Spatialising Sarah Barclay Johnson's travelogue around Jerusalem (1858): Difference between revisions
| (45 intermediate revisions by 3 users not shown) | |||
| Line 9: | Line 9: | ||
= Motivation = | = Motivation = | ||
Although today's entity recognition algorithms are highly advanced, analyzing historical and narrative contexts still poses significant challenges | Although today's entity recognition algorithms are highly advanced, analyzing historical and narrative contexts still poses significant challenges: can we understand the relevance of both long-lasting and lost places, through new insights on human-environment interactions? | ||
We believe it's crucial to enhance the comprehension of travelogues, particularly those that shed light on historical events and epochs. Our motivation is to develop an approach that guides readers in navigating these texts, which are often challenging due to their extensive historical and religious references. | |||
Additionally, in this process, assessing the capabilities of rapidly evolving generative language models within the scope of our project presents an added layer of motivation. This not only contributes to our understanding but also introduces a layer of technological innovation to our historical exploration. | Additionally, in this process, assessing the capabilities of rapidly evolving generative language models within the scope of our project presents an added layer of motivation. This not only contributes to our understanding but also introduces a layer of technological innovation to our historical exploration. | ||
| Line 15: | Line 18: | ||
* Pre-processed textual dataset of the book. | * Pre-processed textual dataset of the book. | ||
* Comparative analysis report of NER effectiveness between Spacy and GPT-4. | * Comparative analysis report of NER effectiveness between Spacy and GPT-4. | ||
* Manually | * Manually labeled dataset for a selected chapter for NER validation. | ||
* Developed scripts for automating Wikipedia page searches and extracting location coordinates. | * Developed scripts for automating Wikipedia page searches and extracting location coordinates. | ||
* Dataset with matched coordinates for all identified locations. | * Dataset with matched coordinates for all identified locations. | ||
* GeoPandas mapping files visualizing named locations from selected chapters and the entire book. | |||
* Visual representative maps of the narrative journey, highlighting key locations and paths. | |||
* A developed platform to display project outputs. | * A developed platform to display project outputs. | ||
= Project Timeline & Milestones = | = Project Timeline & Milestones = | ||
| Line 91: | Line 91: | ||
* Matching the coordinates of the locations from the entire book | * Matching the coordinates of the locations from the entire book | ||
* Retrieving coordinates from matched Wikipedia pages | * Retrieving coordinates from matched Wikipedia pages | ||
* | * GeoPandas Mapping of the locations from the entire book | ||
* Visualizing the full journey | * Visualizing the full journey | ||
| align="center" | ✓ | | align="center" | ✓ | ||
| Line 102: | Line 102: | ||
* Complete Wiki page | * Complete Wiki page | ||
* Complete presentation | * Complete presentation | ||
| align="center" | | | align="center" | ✓ | ||
|- | |- | ||
|} | |} | ||
| Line 116: | Line 116: | ||
=== NER with Spacy === | === NER with Spacy === | ||
In the | In the early stages of the project, [https://spacy.io/api/entityrecognizer Spacy] was employed for Named Entity Recognition (NER) to analyze the text and automatically classify entities such as locations, organizations, and people. SpaCy's pre-trained models and linguistic features facilitated the identification of named entities within the text, allowing for the automatic tagging of toponyms. Specifically, the focus of our project was on extracting toponyms, which are place names or locations relevant to the geographic context of the travelogue, i.e. usually "GPE" (Geopolitical Entities) and "LOC" (Regular Locations) in SpaCy's labeling system. | ||
However, as the project progressed, it became apparent that SpaCy's performance in accurately labeling toponyms was not entirely satisfactory, encountering mislabeling issues that could impact the precision of the spatial representation. Here is the SpaCy output from one sample paragraph: | However, as the project progressed, it became apparent that SpaCy's performance in accurately labeling toponyms was not entirely satisfactory, encountering mislabeling issues that could impact the precision of the spatial representation. Here is the SpaCy output from one sample paragraph: | ||
| Line 171: | Line 171: | ||
Given the issues we encountered with SpaCy, we decided to give GPT-4 a try. We got access to its functionalities through the ChatGPT interface and the Plus subscription plan, including the possibility to attach documents and a model accurately trained for data analysis. | Given the issues we encountered with SpaCy, we decided to give GPT-4 a try. We got access to its functionalities through the ChatGPT interface and the Plus subscription plan, including the possibility to attach documents and a model accurately trained for data analysis. | ||
Our idea was, once again, to collect all the locations in chronological order, and to | Our idea was, once again, to collect all the locations in chronological order, and to encapsulate them in a standardized format like JSON. In addition, we decided to benefit from the LLM by retrieving the interactions that the authors had with the place. | ||
However, our prompt engineering went through many iterations, before getting the results we were aiming for. The main issues we encountered were: | However, our prompt engineering went through many iterations, before getting the results we were aiming for. The main issues we encountered were: | ||
| Line 178: | Line 178: | ||
* the process would stop working whenever an error was found in the analysis | * the process would stop working whenever an error was found in the analysis | ||
For these reasons, we ultimately defined our goal as | For these reasons, we ultimately defined our goal as maximizing the number of locations that the author had a real interaction with, not all the locations cited in the text. In other words, we wanted to give more specificity to the model, while preserving its generalisability. | ||
====The prompt (the parts in italic are for explanation purpose only)==== | |||
''Context of the task'' </br> | ''Context of the task'' </br> | ||
| Line 210: | Line 210: | ||
''Additional details to get uniform results and avoid misunderstandings'' </br> | ''Additional details to get uniform results and avoid misunderstandings'' </br> | ||
Keep the answer short. Do not invent any additional 'interaction' label, assign only one 'interaction' from the list ['observed', 'mentioned', 'visited', 'stayed']. Return me the final | Keep the answer short. Do not invent any additional 'interaction' label, assign only one 'interaction' from the list ['observed', 'mentioned', 'visited', 'stayed']. Return me the final JSON (not just a sample of it). | ||
=== Preliminary Analysis for Model Selection - Assessment Focusing on Chapter 3 === | === Preliminary Analysis for Model Selection - Assessment Focusing on Chapter 3 === | ||
| Line 219: | Line 219: | ||
'''Spacy Results''' | '''Spacy Results''' | ||
[[File:fdh-spacy.png|250px|thumb|right|SpaCy Result]] | |||
With SpaCy, we included results labeled as "GPE", "LOC", "ORG", and "PERSON". To better illustrate the result from SpaCy, we made this Venn graph on the right. | |||
A: False negative, those toponyms in the book that SpaCy didn't get; (16) | A: False negative, those toponyms in the book that SpaCy didn't get; (16) | ||
| Line 247: | Line 248: | ||
'''GPT-4 Results''' | '''GPT-4 Results''' | ||
[[File:fdh-compare.png|400px|thumb|right|SpaCy | [[File:fdh-compare.png|400px|thumb|right| Metrics comparison: GPT-4 vs SpaCy]] | ||
We opted for 2 metrics: | We opted for 2 metrics: | ||
* Accuracy, to compare the places identified both by us and GPT with those identified by just us | * Accuracy, to compare the places identified both by us and GPT with those identified by just us (=0.71) | ||
* Precision, to compare the places identified both by us and GPT with those identified by just GPT | * Precision, to compare the places identified both by us and GPT with those identified by just GPT (=0.879) | ||
Sometimes, GPT would identify a couple of entities with a slight variation from the book, and they would automatically be considered different. | Sometimes, GPT would identify a couple of entities with a slight variation from the book, and they would automatically be considered different. | ||
However, despite our goal | However, despite our goal to reduce our intervention to the least possible, we double-checked manually the entries without correspondence and considered them as correctly identified. | ||
</blockquote> | |||
Since the GPT-4 Results outperformed the results of Spacy NER, the presented GPT-4 prompt has been used to retrieve the locations in the book. 170 locations are saved this way, and visited locations are represented in order by the figure below. | |||
[[File:Network graph.png|1100px|thumb|center|Network graph of visited places]] | |||
=== Matching Wikipedia Pages === | === Matching Wikipedia Pages === | ||
Using the [https://www.mediawiki.org/wiki/API:Main_page Wikipedia API] , locations identified by GPT were searched in Wikipedia, and the first relevant result was recorded. Additionally, the first image found on the page of the recorded link was retrieved. This approach was primarily used to verify the accuracy of manually determined locations. Subsequently, after all locations were obtained, it was used both for visualizing the author's path and for acquiring coordinates for locations without coordinates. | Using the [https://www.mediawiki.org/wiki/API:Main_page Wikipedia API] , locations identified by GPT were searched in Wikipedia, and the first relevant result was recorded. Additionally, the first image found on the page of the recorded link was retrieved. This approach was primarily used to verify the accuracy of manually determined locations. Subsequently, after all locations were obtained, it was used both for visualizing the author's path and for acquiring coordinates for locations without coordinates. | ||
== Tracking Author's Route on Maps == | == Tracking Author's Route on Maps == | ||
| Line 278: | Line 275: | ||
'''1. Fuzzy matching GPT-4 results with an existing location list''' | '''1. Fuzzy matching GPT-4 results with an existing location list''' | ||
We've got a list of existing toponyms in Jerusalem that were extracted previously from one map with coordinates. The list is | We've got a list of existing toponyms in Jerusalem that were extracted previously from one map with coordinates. The compiled list of toponyms is multilingual, encompassing names in English, Arabic, German, and Hebrew for the same locations. Given the diverse linguistic representations and potential variations in referencing, such as historical or cultural nuances, we implemented a fuzzy matching algorithm employing the "fuzzywuzzy" package. | ||
This algorithm was configured with a similarity score threshold set at 80 to ensure a robust matching process. Notably, this approach accommodates discrepancies in the toponyms, allowing for variations like "Church of Flagellation" and "Monastery of the Flagellation" to be successfully identified as referring to the same place. | |||
Upon applying the fuzzy matching algorithm, we achieved a matching success rate of 35 out of 170 toponyms in the list, which comes a bit lower than we had anticipated. This can be attributed in part to the inherent limitations of relying solely on toponyms from a single map source. Recognizing that this dataset may not comprehensively cover all relevant toponyms, further efforts are being dedicated to expanding the toponymic database by incorporating additional diverse sources. | |||
'''2. Retrieving coordinates by matched Wikipedia pages''' | '''2. Retrieving coordinates by matched Wikipedia pages''' | ||
| Line 284: | Line 285: | ||
Utilizing previously obtained Wikipedia links, coordinates were gathered using a web scraping method. To ensure the exclusion of broader locations such as the 'Mediterranean Sea,' the coordinates obtained were filtered to focus specifically on the Jerusalem region. For locations where coordinates could not be determined in the previous step, additional coordinate information was added, culminating in the final version of the dataset being recorded. | Utilizing previously obtained Wikipedia links, coordinates were gathered using a web scraping method. To ensure the exclusion of broader locations such as the 'Mediterranean Sea,' the coordinates obtained were filtered to focus specifically on the Jerusalem region. For locations where coordinates could not be determined in the previous step, additional coordinate information was added, culminating in the final version of the dataset being recorded. | ||
Although the majority of the identified places' locations were obtained, it should be noted that only the places within the Jerusalem region were filtered. As a result, despite the detection of many locations in chapters 1 and 2, which the author wrote before arriving in Jerusalem, their coordinates have not been included because they are not within the Jerusalem region. | |||
[[File:contents.png|400px|thumb|right|]] | |||
{| class="wikitable" | {| class="wikitable" | ||
| Line 330: | Line 333: | ||
=== Visualization by GeoPandas === | === Visualization by GeoPandas === | ||
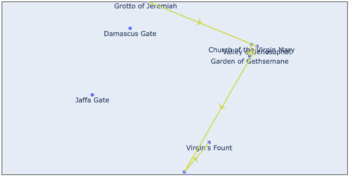
[[File:first_map.png| | [[File:first_map.png|350px|thumb|right|Prototype of the map (all chapters)]] | ||
Our initial plan, was to work on QGIS. However, we moved everything to our Jupyter notebooks to work directly with GeoPandas. | Our initial plan, was to work on QGIS. However, we moved everything to our Jupyter notebooks to work directly with [https://geopandas.org/en/stable/docs.html GeoPandas]. | ||
After checking the coordinates system and matching the coordinates with our final JSON for all the chapters, we started developing our visualization by drafting a map that would not represent Jerusalem's background, but would just use Plotly and its "geo" functionalities to plot the entire journey. | After checking the coordinates system and matching the coordinates with our final JSON for all the chapters, we started developing our visualization by drafting a map that would not represent Jerusalem's background, but would just use [https://plotly.com/python/map-configuration/ Plotly] and its "geo" functionalities to plot the entire journey. | ||
To do so, we first scattered all the locations on the geo-referenced background, than we added the lines between every connected stop and we ultimately introduced a visual element in the middle points of every line, to represent the direction of the journey. In addition, we set the hover in a way that it would display the description of the interaction the author had with the place. | To do so, we first scattered all the locations on the geo-referenced background, than we added the lines between every connected stop and we ultimately introduced a visual element in the middle points of every line, to represent the direction of the journey. In addition, we set the hover in a way that it would display the description of the interaction the author had with the place. | ||
| Line 341: | Line 344: | ||
To improve the readability of the maps, we decided to divide them into individual maps, chapter by chapter. | To improve the readability of the maps, we decided to divide them into individual maps, chapter by chapter. | ||
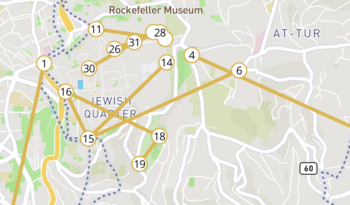
[[File:map_ch4.png| | [[File:map_ch4.png|350px|thumb|right| Journey of chapter 4 (Sample from the prototype)]] | ||
To improve our visualization, we decided to use Mapbox's API to plot our journey on the real map of Jerusalem. Despite this redesign made us lose some Plotly functionalities (such as the visual element for the direction), we managed to achieve a smooth and intuitive interaction. | To improve our visualization, we decided to use [https://www.mapbox.com/ Mapbox's] API to plot our journey on the real map of Jerusalem. Despite this redesign made us lose some Plotly functionalities (such as the visual element for the direction), we managed to achieve a smooth and intuitive interaction. | ||
When developing our visualization pipeline, we realised that: | When developing our visualization pipeline, we realised that: | ||
* The author may return many times to the same place, but GPT-4 may slightly change its name in the JSON for every time an interaction happens. This leads to overlapping names that affect the readability of the labels. | * The author may return many times to the same place, but GPT-4 may slightly change its name in the JSON for every time an interaction happens. This leads to overlapping names that affect the readability of the labels. | ||
* Some locations are disconnected from the journey: this happens because, whenever a georeferenced location would appear in the data before and after a location without coordinates, there would be no points in the map to create a connection with. | * Some locations are disconnected from the journey: this happens because, whenever a georeferenced location would appear in the data before and after a location without coordinates, there would be no points in the map to create a connection with. | ||
[[File:map_ch3_numbers.png|350px|thumb|right| Journey of chapter 3 (Sample from the final version)]] | |||
[[File:map_ch3_numbers.png| | |||
=== Creating a Platform for Final Output === | === Creating a Platform for Final Output === | ||
To display our final output, we built a [https://jiaming-jiang.github.io/fdh-web/ website] | To display our final output, we built a [https://jiaming-jiang.github.io/fdh-web/ website] that shows the overview of the project and interactive maps featuring toponyms from each chapter of the travelogue. The website provides an intuitive interface for users to navigate through different chapters and explore associated toponyms. The interactive maps offer a basic yet effective means for users to visualize the geographical references in the travelogue. | ||
= Results = | = Results = | ||
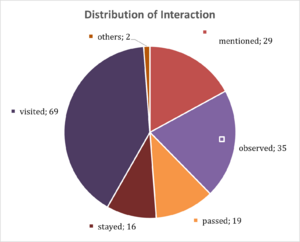
[[File:Interaction.png|300px|thumb|right|Distribution of Interaction Types]] | |||
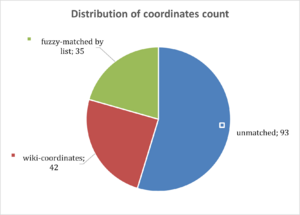
[[File:coordinates.png|300px|thumb| Distribution of Coordinates Count ]] | |||
After evaluating the Named Entity Recognition (NER) models against a manually curated list, we identified a total of 170 places, with 132 being unique, using GPT-4. Even if this is not affecting the ultimate scope of the project, it is important to highlight that some of the assigned interactions fall outside the 4 defined in our prompt. We analyzed the 'distribution of interaction types' to understand the narrator's relationship with these locations. The most frequent category was 'visited,' comprising 69 places. | |||
Next, we matched these identified places with their coordinates to create our final mapping list. During this phase, we determined the coordinates for 35 locations through fuzzy matching with an existing shapefile. Additionally, for 42 other places, we obtained coordinates by scraping information from Wikipedia links. | |||
The final component of our project is an interactive map of Jerusalem, which tracks the route taken by Sarah Barclay Johnson. This map features the coordinates, descriptions, and the sequence of the locations as mentioned in the book. On our developed platform, users can access both the collection of identified places and the chapter-wise filtered maps, serving as a comprehensive guide to the travelogue. | |||
= Limitations and further work = | = Limitations and further work = | ||
| Line 366: | Line 376: | ||
* expanding the pipeline to apply it to other travelogues and similar texts; | * expanding the pipeline to apply it to other travelogues and similar texts; | ||
* increasing the interaction with the map for a more immersive experience (ie. [AI generated] images of the locations on hover, an | * increasing the interaction with the map for a more immersive experience (ie. [AI generated] images of the locations on hover, an older version of Jerusalem's map as a background) | ||
* enhancing the historical connection within the project by incorporating historical documents, relevant excerpts, or contextual information about the historical significance of each location; | |||
* adding open source or community functionalities to receive support in the growth of the project (ie. collect the missing coordinates) | * adding open source or community functionalities to receive support in the growth of the project (ie. collect the missing coordinates) | ||
<!-- | <!-- | ||
automated application for all historical context | automated application for all historical context | ||
| Line 378: | Line 389: | ||
= Conclusion = | = Conclusion = | ||
Over the semester, we explored a variety of techniques that gave Johnson's travelogue a new life. Ranging from NER to GIS, we assembled technical tools for different fields to enhance the power of historical data. Despite many improvements can be done to smoothen both the data collection and its visual experience, this project sets the starting point for what could be a broader vision, where human-environment interactions studies meet history. Expanding this analysis to more books may in fact bring new tools for experts and researchers, and it can provide an intuitive and accessible historical platform to new audiences. | |||
= GitHub Repository = | = GitHub Repository = | ||
| Line 383: | Line 395: | ||
[https://github.com/jiaming-jiang/FDH-G8.git GitHub Link] | [https://github.com/jiaming-jiang/FDH-G8.git GitHub Link] | ||
= = | = Credits = | ||
'''Course: ''' Foundation of Digital Humanities (DH-405), EPFL </br> | |||
'''Professor:''' Frédéric Kaplan</br> | |||
'''Supervisors: '''Sven Najem-Meyer, Beatrice Vaienti</br> | |||
'''Authors: '''Daniele Belfiore, Nil Yagmur Ilba, Jiaming Jiang | |||
Latest revision as of 15:40, 20 December 2023
Introduction
Delving into the pages of "Hadji in Syria: or, Three years in Jerusalem" by Sarah Barclay Johnson 1858, this project sets out to digitally map the toponyms embedded in Johnson's 19th-century exploration of Jerusalem with the wish to connect the past and the present. By visualizing Johnson's recorded toponyms, this project aims to offer a dynamic tool for scholars and enthusiasts, contributing to the ongoing dialogue on the city's historical evolution.
This spatialization, in its attempt, pays homage to Johnson's literary contribution, serving as a digital window into the cultural crossroads: Jerusalem. The project invites users to engage with the city's history, fostering a deeper understanding of its rich heritage and the interconnected narratives that have shaped the city. In this fusion of literature, history, and technology, we hope to embark on a digital odyssey, weaving a narrative tapestry that transcends time and enriches our collective understanding of Jerusalem's intricate past.
Motivation
Although today's entity recognition algorithms are highly advanced, analyzing historical and narrative contexts still poses significant challenges: can we understand the relevance of both long-lasting and lost places, through new insights on human-environment interactions?
We believe it's crucial to enhance the comprehension of travelogues, particularly those that shed light on historical events and epochs. Our motivation is to develop an approach that guides readers in navigating these texts, which are often challenging due to their extensive historical and religious references.
Additionally, in this process, assessing the capabilities of rapidly evolving generative language models within the scope of our project presents an added layer of motivation. This not only contributes to our understanding but also introduces a layer of technological innovation to our historical exploration.
Deliverables
- Pre-processed textual dataset of the book.
- Comparative analysis report of NER effectiveness between Spacy and GPT-4.
- Manually labeled dataset for a selected chapter for NER validation.
- Developed scripts for automating Wikipedia page searches and extracting location coordinates.
- Dataset with matched coordinates for all identified locations.
- GeoPandas mapping files visualizing named locations from selected chapters and the entire book.
- Visual representative maps of the narrative journey, highlighting key locations and paths.
- A developed platform to display project outputs.
Project Timeline & Milestones
| Timeframe | Task | Completion |
|---|---|---|
| Week 4 |
|
✓ |
| Week 5 |
|
✓ |
| Week 6 |
|
✓ |
| Week 7 |
|
✓ |
| Week 8 |
|
✓ |
| Week 9 |
|
✓ |
| Week 10 |
|
✓ |
| Week 11 |
|
✓ |
| Week 12 |
|
✓ |
| Week 13 |
|
✓ |
| Week 14 |
|
✓ |
Methodology
Assessing and Preparing OCR-Derived Text for Analysis
In our project, which involved analyzing a specific book, the initial step was to acquire the text version of the book. We found and downloaded the OCR text from Google Books and then assessed the quality of the textual data. A key metric in our assessment was the ratio of “words in the text that exist in a dictionary” to “total words” in the text, calculated using the NLTK library. Considering the book's inclusion of multiple languages, we set a threshold of 70% for this ratio. If met or exceeded, we regarded the text's quality satisfactory for our analysis purposes.
Following this quality assessment, we proceeded with text preprocessing, adapted to the specific needs of our study. Notably, we chose not to remove stop words or convert the text to lowercase, maintaining the original structure and form of the text.
Detecting Locations
NER with Spacy
In the early stages of the project, Spacy was employed for Named Entity Recognition (NER) to analyze the text and automatically classify entities such as locations, organizations, and people. SpaCy's pre-trained models and linguistic features facilitated the identification of named entities within the text, allowing for the automatic tagging of toponyms. Specifically, the focus of our project was on extracting toponyms, which are place names or locations relevant to the geographic context of the travelogue, i.e. usually "GPE" (Geopolitical Entities) and "LOC" (Regular Locations) in SpaCy's labeling system.
However, as the project progressed, it became apparent that SpaCy's performance in accurately labeling toponyms was not entirely satisfactory, encountering mislabeling issues that could impact the precision of the spatial representation. Here is the SpaCy output from one sample paragraph:
| Toponym Name | NER Label | Correct Label |
|---|---|---|
| Bethlehem | ORG | GPE |
| Bethany | GPE | GPE |
| Mary | PERSON | PERSON |
| meek | PERSON | N.A. |
| Lazarus | ORG | PERSON |
| Christ | ORG | PERSON |
| Calvary | ORG | LOC |
| Olivet | PERSON | LOC |
So, there is a mislabeling problem. In theory we only need to retrieve the toponyms, i.e. “GPE” & “LOC”, but SpaCy labelled some of them as “PERSON” or “ORG”. In other words, if we only select “GPE” and “LOC”, we’ll lose some toponyms; if we also select “ORG” and “PERSON”, we’ll get some non-toponyms.
Difficulties when working with historical content
When applying Named Entity Recognition (NER) with Spacy to historical content, we encountered significant challenges. The main problem was the frequent misnaming of locations, which is a result of place names changing over time, especially in historical and biblical contexts. These names often have varied across multiple languages, adding to the complexity. Furthermore, even by reading, it was occasionally challenging to determine the current significance or identity of these names due to their changing nature over centuries. This complexity highlighted how essential it is to understand the relationships between locations and what they mean within the book's narrative along with to representing a linguistic and technical challenge. It is critical to comprehend these relationships because they have a significant impact on how the text is interpreted and understood overall.
GPT-4
Given the issues we encountered with SpaCy, we decided to give GPT-4 a try. We got access to its functionalities through the ChatGPT interface and the Plus subscription plan, including the possibility to attach documents and a model accurately trained for data analysis.
Our idea was, once again, to collect all the locations in chronological order, and to encapsulate them in a standardized format like JSON. In addition, we decided to benefit from the LLM by retrieving the interactions that the authors had with the place.
However, our prompt engineering went through many iterations, before getting the results we were aiming for. The main issues we encountered were:
- the returned JSON file would not include all the locations in the text
- the labels and the format of the entry would change with every request
- the process would stop working whenever an error was found in the analysis
For these reasons, we ultimately defined our goal as maximizing the number of locations that the author had a real interaction with, not all the locations cited in the text. In other words, we wanted to give more specificity to the model, while preserving its generalisability.
The prompt (the parts in italic are for explanation purpose only)
Context of the task
I'm analyzing a travelogue written in the 19th century around Ancient Israel and Jerusalem, with the future goal of mapping all the locations visited.
Instructions of the task
I'm gonna provide you the chapter. Can you provide me the specific named entities of the places the author had an interaction with?
Guidelines for the entries
I want the named entities in chronological list. I don't want all the places mentioned, just the places observed from the distance, passed by, visited or where the author stayed for the night. Generate a neutral description of the interaction the author had with the place, in one sentence.
Specificity and comprehensivity
Please provide a comprehensive list of the locations mentioned in the text, including any buildings, gates, streets, and significant landmarks. Do not provide only the main places, but a comprehensive set of places.
Technical details of the entries
Please provide them in a JSON format, where you specify the name, the brief description and one label from ['observed', 'mentioned', 'visited', 'stayed']
Example of an often ignored place
Example of an entry:
- {
- "place": "Church of Yacobeiah",
- "interaction": "visited",
- "description": "Visited the ruins of the Church of Yacobeiah, a relic of the crusaders."
- }
Iteration nudge to avoid involuntary crashes
If the first language model does not work, try with something else. Keep trying until you get a solution.
Additional details to get uniform results and avoid misunderstandings
Keep the answer short. Do not invent any additional 'interaction' label, assign only one 'interaction' from the list ['observed', 'mentioned', 'visited', 'stayed']. Return me the final JSON (not just a sample of it).
Preliminary Analysis for Model Selection - Assessment Focusing on Chapter 3
Manual detection
In our preliminary analysis for model selection, we focused on Chapter 3 for a detailed assessment. The initial step involved manually detecting and labeling named entities, specifically locations mentioned in the text. This was achieved by highlighting relevant text segments and subsequently gathering these identified locations into a spreadsheet. To ensure the accuracy of our location identification, each location was cross-referenced with its corresponding Wikipedia page. This was an important step, especially in cases where the context of the book made it challenging to understand the exact nature of the places mentioned, even after analyzing the entire paragraph. This method provided a solid foundation for our named entity recognition approach.
Spacy Results
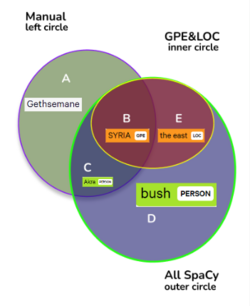
With SpaCy, we included results labeled as "GPE", "LOC", "ORG", and "PERSON". To better illustrate the result from SpaCy, we made this Venn graph on the right.
A: False negative, those toponyms in the book that SpaCy didn't get; (16)
B: True positive, with correct labels (GPE & LOC); (13)
C: True positive, with wrong labels (ORG & PERSON); (17)
D: False positive, with correct labels (GPE & LOC); (68)
E: False positive, with wrong labels (ORG & PERSON); (13)
Based on these sets, we proposed several metrics to assess the SpaCy results:
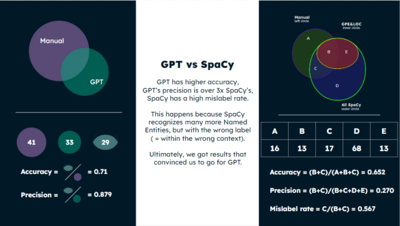
Accuracy: (B+C)/(A+B+C) = 0.652
Precision: (B+C)/(B+C+D+E) = 0.270
Mislabelling rate: C/(B+C) = 0.567
Thus, if we exclude the ones labeled as "ORG" and "PEOPLE", the new Accuracy would be B/(A+B) = 0.448, and the new Precision would be B/(B+E) = 0.5.
In either case, the results are not satisfying enough.
GPT-4 ResultsWe opted for 2 metrics:
- Accuracy, to compare the places identified both by us and GPT with those identified by just us (=0.71)
- Precision, to compare the places identified both by us and GPT with those identified by just GPT (=0.879)
Sometimes, GPT would identify a couple of entities with a slight variation from the book, and they would automatically be considered different.
However, despite our goal to reduce our intervention to the least possible, we double-checked manually the entries without correspondence and considered them as correctly identified.
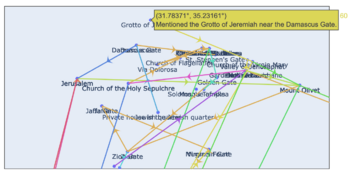
Since the GPT-4 Results outperformed the results of Spacy NER, the presented GPT-4 prompt has been used to retrieve the locations in the book. 170 locations are saved this way, and visited locations are represented in order by the figure below.
Matching Wikipedia Pages
Using the Wikipedia API , locations identified by GPT were searched in Wikipedia, and the first relevant result was recorded. Additionally, the first image found on the page of the recorded link was retrieved. This approach was primarily used to verify the accuracy of manually determined locations. Subsequently, after all locations were obtained, it was used both for visualizing the author's path and for acquiring coordinates for locations without coordinates.
Tracking Author's Route on Maps
Finalizing the List of Coordinates
1. Fuzzy matching GPT-4 results with an existing location list
We've got a list of existing toponyms in Jerusalem that were extracted previously from one map with coordinates. The compiled list of toponyms is multilingual, encompassing names in English, Arabic, German, and Hebrew for the same locations. Given the diverse linguistic representations and potential variations in referencing, such as historical or cultural nuances, we implemented a fuzzy matching algorithm employing the "fuzzywuzzy" package.
This algorithm was configured with a similarity score threshold set at 80 to ensure a robust matching process. Notably, this approach accommodates discrepancies in the toponyms, allowing for variations like "Church of Flagellation" and "Monastery of the Flagellation" to be successfully identified as referring to the same place.
Upon applying the fuzzy matching algorithm, we achieved a matching success rate of 35 out of 170 toponyms in the list, which comes a bit lower than we had anticipated. This can be attributed in part to the inherent limitations of relying solely on toponyms from a single map source. Recognizing that this dataset may not comprehensively cover all relevant toponyms, further efforts are being dedicated to expanding the toponymic database by incorporating additional diverse sources.
2. Retrieving coordinates by matched Wikipedia pages
Utilizing previously obtained Wikipedia links, coordinates were gathered using a web scraping method. To ensure the exclusion of broader locations such as the 'Mediterranean Sea,' the coordinates obtained were filtered to focus specifically on the Jerusalem region. For locations where coordinates could not be determined in the previous step, additional coordinate information was added, culminating in the final version of the dataset being recorded.
Although the majority of the identified places' locations were obtained, it should be noted that only the places within the Jerusalem region were filtered. As a result, despite the detection of many locations in chapters 1 and 2, which the author wrote before arriving in Jerusalem, their coordinates have not been included because they are not within the Jerusalem region.
| Chapter | Count of Geometry | Count of Location |
|---|---|---|
| 1 | 1 | 7 |
| 2 | 2 | 16 |
| 3 | 21 | 32 |
| 4 | 9 | 16 |
| 5 | 4 | 6 |
| 6 | 1 | 4 |
| 7 | 4 | 11 |
| 8 | 7 | 10 |
| 9 | 2 | 7 |
| 10 | 4 | 8 |
| 11 | 3 | 8 |
| 12 | 2 | 4 |
| 13 | 4 | 6 |
| 14 | - | 4 |
| 16 | 4 | 12 |
| 18 | 4 | 7 |
| 19 | 2 | 7 |
| 20 | 3 | 5 |
| Grand Total | 77 | 170 |
Visualization by GeoPandas
Our initial plan, was to work on QGIS. However, we moved everything to our Jupyter notebooks to work directly with GeoPandas.
After checking the coordinates system and matching the coordinates with our final JSON for all the chapters, we started developing our visualization by drafting a map that would not represent Jerusalem's background, but would just use Plotly and its "geo" functionalities to plot the entire journey.
To do so, we first scattered all the locations on the geo-referenced background, than we added the lines between every connected stop and we ultimately introduced a visual element in the middle points of every line, to represent the direction of the journey. In addition, we set the hover in a way that it would display the description of the interaction the author had with the place.
To improve the readability of the maps, we decided to divide them into individual maps, chapter by chapter.
To improve our visualization, we decided to use Mapbox's API to plot our journey on the real map of Jerusalem. Despite this redesign made us lose some Plotly functionalities (such as the visual element for the direction), we managed to achieve a smooth and intuitive interaction.
When developing our visualization pipeline, we realised that:
- The author may return many times to the same place, but GPT-4 may slightly change its name in the JSON for every time an interaction happens. This leads to overlapping names that affect the readability of the labels.
- Some locations are disconnected from the journey: this happens because, whenever a georeferenced location would appear in the data before and after a location without coordinates, there would be no points in the map to create a connection with.
Creating a Platform for Final Output
To display our final output, we built a website that shows the overview of the project and interactive maps featuring toponyms from each chapter of the travelogue. The website provides an intuitive interface for users to navigate through different chapters and explore associated toponyms. The interactive maps offer a basic yet effective means for users to visualize the geographical references in the travelogue.
Results
After evaluating the Named Entity Recognition (NER) models against a manually curated list, we identified a total of 170 places, with 132 being unique, using GPT-4. Even if this is not affecting the ultimate scope of the project, it is important to highlight that some of the assigned interactions fall outside the 4 defined in our prompt. We analyzed the 'distribution of interaction types' to understand the narrator's relationship with these locations. The most frequent category was 'visited,' comprising 69 places.
Next, we matched these identified places with their coordinates to create our final mapping list. During this phase, we determined the coordinates for 35 locations through fuzzy matching with an existing shapefile. Additionally, for 42 other places, we obtained coordinates by scraping information from Wikipedia links.
The final component of our project is an interactive map of Jerusalem, which tracks the route taken by Sarah Barclay Johnson. This map features the coordinates, descriptions, and the sequence of the locations as mentioned in the book. On our developed platform, users can access both the collection of identified places and the chapter-wise filtered maps, serving as a comprehensive guide to the travelogue.
Limitations and further work
We built an extensive and comprehensive pipeline that goes from the initial text to the final visualization, many improvements can be done:
- instead of accessing GPT-4 functionalities through ChatGPT's interface, a smoother data pipeline can be developed to use the API and automatically retrieve the JSONs needed;
- along with the previous points, further tweaks can be done to get all the JSONs by providing the model the entire book, instead of doing it chapter by chapter;
- expanding the pipeline to apply it to other travelogues and similar texts;
- increasing the interaction with the map for a more immersive experience (ie. [AI generated] images of the locations on hover, an older version of Jerusalem's map as a background)
- enhancing the historical connection within the project by incorporating historical documents, relevant excerpts, or contextual information about the historical significance of each location;
- adding open source or community functionalities to receive support in the growth of the project (ie. collect the missing coordinates)
Conclusion
Over the semester, we explored a variety of techniques that gave Johnson's travelogue a new life. Ranging from NER to GIS, we assembled technical tools for different fields to enhance the power of historical data. Despite many improvements can be done to smoothen both the data collection and its visual experience, this project sets the starting point for what could be a broader vision, where human-environment interactions studies meet history. Expanding this analysis to more books may in fact bring new tools for experts and researchers, and it can provide an intuitive and accessible historical platform to new audiences.
GitHub Repository
Credits
Course: Foundation of Digital Humanities (DH-405), EPFL
Professor: Frédéric Kaplan
Supervisors: Sven Najem-Meyer, Beatrice Vaienti
Authors: Daniele Belfiore, Nil Yagmur Ilba, Jiaming Jiang

