Venice Families and Real Estate: Difference between revisions
No edit summary |
Hannah.casey (talk | contribs) No edit summary |
||
| (4 intermediate revisions by 2 users not shown) | |||
| Line 60: | Line 60: | ||
[[File:Catastici_static_map.png|700px]] | [[File:Catastici_static_map.png|700px]] | ||
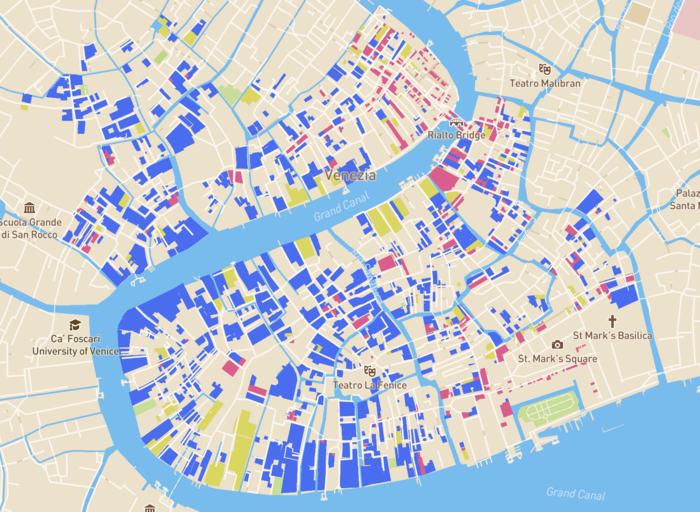
'''Figure: | '''Figure 1:''' ''Plot showing the static image of Venice in 1748. Dark blue shows housing, the yellow shows shops, and the red everything else.'' | ||
In comparison to the Cadaster, we don’t have data for all of Venice in the Catastici, but instead limited to a few regions of Venice as evidenced in the map. | In comparison to the Cadaster, we don’t have data for all of Venice in the Catastici, but instead limited to a few regions of Venice as evidenced in the map. | ||
| Line 74: | Line 74: | ||
[[File:CatasticiOwnerData.png|700px]] | [[File:CatasticiOwnerData.png|700px]] | ||
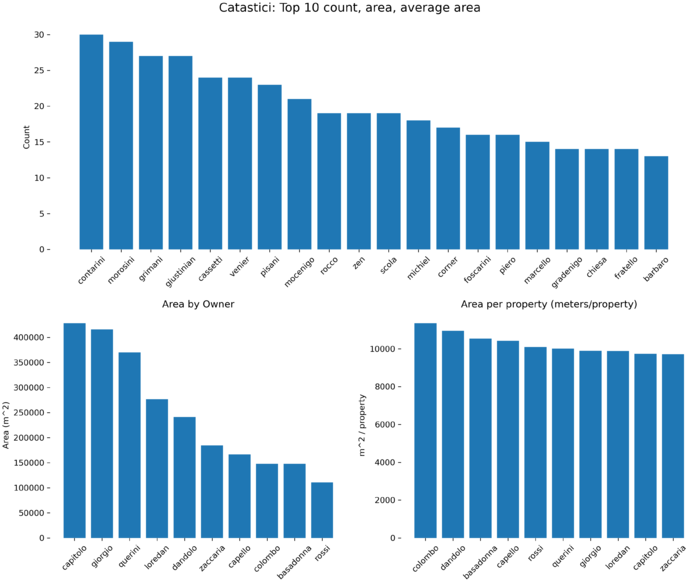
'''Figure: | '''Figure 2:''' ''The breakdown of family ownership in the 1748 Catastici.'' | ||
====Travelling forward: 1808==== | ====Travelling forward: 1808==== | ||
| Line 83: | Line 83: | ||
[[File:cadaster_static_image.png|700px]] | [[File:cadaster_static_image.png|700px]] | ||
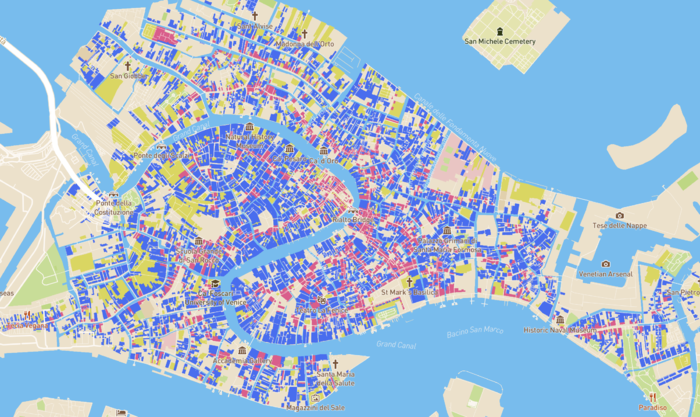
'''Figure: | '''Figure 3:''' ''In this plot the dark blue shows housing, the yellow shows shops, and the red everything else.'' | ||
| Line 92: | Line 92: | ||
[[File:CadasterOwnerData.png|700px]]. | [[File:CadasterOwnerData.png|700px]]. | ||
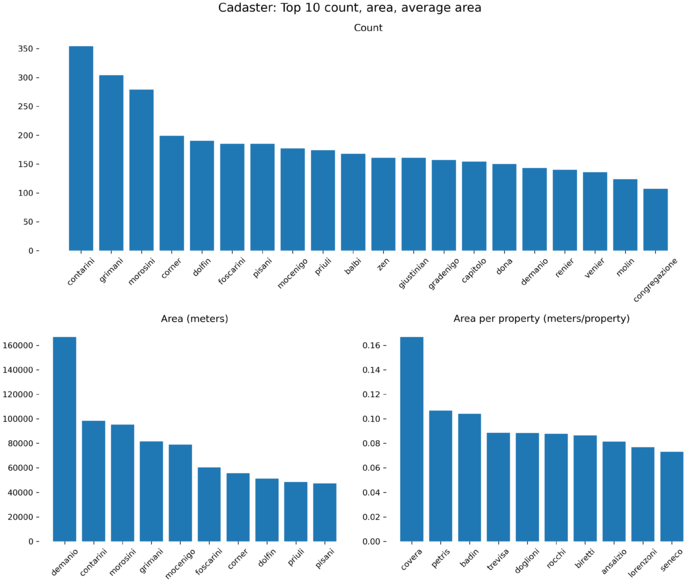
'''Figure: | '''Figure 4:''' ''The breakdown of family ownership in the 1808 Cadaster.'' | ||
| Line 100: | Line 100: | ||
[[File:Property change.png|700px]] | [[File:Property change.png|700px]] | ||
'''Figure: | '''Figure 5:''' ''Illustration the change in property type between the two periods.'' | ||
| Line 107: | Line 107: | ||
[[File:Difference.png|700px]] | [[File:Difference.png|700px]] | ||
'''Figure: | '''Figure 6:''' ''Geographic illustration of the change in property type between the two periods.'' | ||
| Line 118: | Line 118: | ||
[[File:Z score histogram.png|700px]] | [[File:Z score histogram.png|700px]] | ||
'''Figure: | '''Figure 7:''' ''Change in family power captured by z-score.'' | ||
| Line 125: | Line 125: | ||
=Quality assesment and limitations= | =Quality assesment and limitations= | ||
* | |||
* | * Removing the public institutions from the family datasets is a quality limitation, as we suspect our list not to be extensive. It was created while browsing through the dataset and adding all the public institutions we could find. | ||
* | |||
* Another limitation occurred when renaming the italian expressions. While it was an effective way to make the Cadaster and Catastici dataset compatible, the harmonization effort failed in some occasions. | |||
* As the names of the families are ambiguous, we would ideally find a way to disambiguate them in future work. This might be done using other sources and digitalized datasets that might shine light on who's who. | |||
* For our analysis we focused only on the areas for which we have both an entry in the Cadaster and in the Catastici dataset. This poses the probably biggest limitation to our research. However, this could easily be extended in future work, if the Catastici dataset was to be extended | |||
=Conclusion= | =Conclusion= | ||
| Line 200: | Line 204: | ||
* Finish design and details of website | * Finish design and details of website | ||
* Finish project deliverables | * Finish project deliverables | ||
| | | X | ||
✓ | |||
|} | |} | ||
= | =Links= | ||
Github repository: https://github.com/vminvsky/FDH_project.git | |||
Latest revision as of 08:44, 24 December 2021
Introduction
In this project we take the reader back in time, through our Venetian Time Machine, to two critical points in Venice’s history: 1748 and 1808. Rife with conflict, development, and Venetian love, these two period offer a look into the life before us. The composition of cities, the family power dynamics, and the cities progressions. We’ll call the data from 1748 the Catastici the data from 1808 the Cadaster. The Catastici and the Cadaster hold information about who owned buildings in Venice in the years 1741 and 1808. In order to find out how power shifted between families in this time, we will look at the change in real estate between these years.
Motivation
“Life in the state of nature is solitary, poor, nasty, brutish and short.” - Hobbes
History has repeatedly shown us that empires rise and fall, cities evolve and change, and families battle for power. Up until now, historians have relied largely on diaries, archives, interviews, and city plans to qualitatively track these dynamics. But, while effective at understanding a static picture of a city through the lens of a few families, it becomes increasingly complex to track the evolution of an environment. The Venice Time Machine Project has aimed to digitize large swaths of archival data to permit new forms of analysis that up until now have not been possible. In our research we focus on two new sources of data, Venice’s 1748 Catastici and 1808 Cadaster. These two geographic datasets contain information about parcels of land across Venice like ownership, tenants, area, and category of property. In this project we use these data sources to paint a static picture of Venice in both periods, and then track its evolution during a period rife with conflict, like Napoleon’s invasion in 1797. After conducting the analysis, we create a website to present the data and findings in a visually appealing way, which can be of use for future Venice researchers.
Research Questions
More specifically, we tackled three main questions.
- What was the static distribution of power in Venice in 1748 and 1808.
- Who was the most powerful?
- What were the relationships between families
- How did the dynamics between families change?
- Biggest upsets!
- New faces.
- How did the landscape of Venice change?
- Were locations nationalized or increasingly privatized?
- How did the type of location change?
Plan and Milestones
First Steps
The first step working on the project was to familiarize ourselves with the datasets. We started working on the cadaster, as we assumed it would be easier to handle. After extracting some general information about the owners of the parcels, we quickly ran into our first problem: the parcel owner names are not constructed in a homogenous way. This is due to the way the data was extracted, and as it is based on scans of handwritten documents, we found we had to deal with all kinds of problems associated with handwritten documents.
The Sudetto problem
The “suddetto problem” appeared quite early when working with the cadaster from 1808. In Italian, suddetto means “aforementioned” and was used whenever a family name was consecutively mentioned in the dataset.
When multiple consecutive parcels have the same owner, most of the later entries would have no owner specified anymore but the value of the column was 'suddetto'. In theory, this issue would be easily fixed through a forward fill, but unfortunately this was not uniformly conducted on the dataset. Instead, some locations utilized the suddetto method, others reverted to properly naming all locations. Fixing this issue required doing a location specific forward fill to align each parcel of land with the correct owner.
Family names
Regex search:
Since most of our analysis is based on families and we assume that if an owner of a parcel has the same surname as another, they belong to the same family, extracting the family names was one of the first tasks we tackled.
The datasets were both cleaned using OpenRefine, in order to cluster similar entries for the ‘parcelOwner’ feature. The text facets were clustered using key collision and fingerprinting as the keying functions. Using the functionality of OpenRefine, we managed to rid the noise in both the Catastici and the Cadaster datasets. For the Cadaster dataset we assume that for most of the areas (all except ‘Canareggio’) the surnames of parcel owners are written in capital letters. Using this information, we tried to extract some family names from the cadaster using a simple regex pattern matching. However, some other entities are also written in all capitals, especially public institutions. In order to filter the public institutions and other noise that might be in the extracted family names, they were compared to a list of venetian family names. The list contains information about families in old Venice like their noble status. Unfortunately, the list also contains all names of public institutions, so instead we filtered the family names using a handwritten list of public institutions.
For the catastici from 1741, it was found that approximately 40% of the entries for entry owner column are under the format 'name surname' so they were rather easy to extract. Additionally, assuming that the order of the names is correct, it was simple to extract family names and even names of the owners. For the other 60% of the dataset, it is not yet clear if there is a specific format. It contains a lot of additional information about the relations of the owners of the parcels. For example the entry “Giovanni Paolo e fratelli Palmerini” suggests that Giovanni Paolo and the Palmerini brothers owned the parcel together. There are many more entries of similar format, giving this kind of information that we haven’t attempted to extract at this point.
Fuzzy name extraction:
Instead of a simple regex search, we turn to a fuzzy name extraction method that’s capable of finding a name’s closest match in a list. Given a family name, we found the closest match in the set of known Venetian family names. Fuzzy name extraction conducts the string matching by choosing the family name with the minimum Levenshtein distance (shown below) and returns a probability that the name is a match. To limit noise we removed names that were not names, like “di” and “scuola” and then found the closest names. Python’s fuzzywuzzy package provided a simple and quick method of applying fuzzy name extraction on the large name column, and it is also capable of doing substring matching, which is what we needed to extract only the last name. We were able to extract the names for 16,000 rows (88%).
Italian name translations:
Connecting the catastici and the cadaster dataset proved more difficult than expected. This is largely due to the differing origins of the datasets. Whereas, for the catastici, surveyors went out and manually validated data, the cadaster was automatically generated from texts. This asymmetry leads to difficulty when merging the two datasets. One of the examples of the issue came from the way parcels were categorized. In the catastici a simple english naming was used and in the cadaster we had a series of 20 different Italian names, written in an archaic language Google Translate failed to understand. To fix this issue, we attempted to manually translate the Italian words into the corresponding English names.
Analysis
Static image
After the data cleaning done above, we turned to analyzing the datasets. We commenced with a static image of both locations. This included the most famous families, the composition of the land, and relationships between the tenants and owners.
Jumping into the time machine: back to 1748
To begin, we visualize the map of the Catastici data below.
Figure 1: Plot showing the static image of Venice in 1748. Dark blue shows housing, the yellow shows shops, and the red everything else.
In comparison to the Cadaster, we don’t have data for all of Venice in the Catastici, but instead limited to a few regions of Venice as evidenced in the map.
Next we turn to understanding the composition of the land. Who were the owners, what land did they own, and who did they rent to.
To understand the number of properties a family owns, we drop the duplicates in the Catastici dataset. This was done because there are often several parcels listed under one parcel. Instead of counting each of these subparcels as a piece of land, we will do the count on the parcel level. For the area plot we instead keep all the duplicates on parcels, as the sum of the areas of the subparcels equals to sum of the area for one parcel. Finally we examine the average area per parcel. This last metric will reveal whether the land owned by someone is large or small since area might be a bad metric. Here we limit to families with at least ten properties.
The Catastici reveals that in 1748, the main families in terms of number of properties Contarini, Morosini, Grimani, and Glustinian. Interestingly, this list differs from the number of area which is more concentrated in the hands of the Capitolo, Giorgio, Querini, and Loredan.
The area per proprty shows the families who on average owned the largest parcels of land. These include the Colombo, Dandolo, and Basadonna.
Figure 2: The breakdown of family ownership in the 1748 Catastici.
Travelling forward: 1808
Critically, the Cadaster differs from the Catastici in that it was generated automatically, using OCR on the Napoleonic map and census data from 1808. Thus, the dataset covers more ground. We begin by plotting the map of the Cadaster showing Venetian land.
It is interesting to observe that in the central city, the number of houses actually appears to decline in comparison with the Catastici. Locations that before were houses have now converted into shops, and more.
Figure 3: In this plot the dark blue shows housing, the yellow shows shops, and the red everything else.
The most famous families in terms of number of properties remained markedly similar to the Catastici with the Contarini, Grimani, Morosini, and Dolfin coming out on top.
In terms of area, now we are seeing the Demanio on the list. This translates to state property, which is not present in the Catastici.
Figure 4: The breakdown of family ownership in the 1808 Cadaster.
A foot in both time periods: Comparing 1748 and 1808
We now turn to tracking how the land evolved. We begin by presenting a broad overview of how the land changed. We find that in general, Venice saw a reduction in housing and shops began to occupy more of the land. This result is limited to locations where we have data for both the cadaster and the catastici. Overall, this result signifies that as the city developed between the two periods, the center saw a reduction in housing and an increase in commerce.
Figure 5: Illustration the change in property type between the two periods.
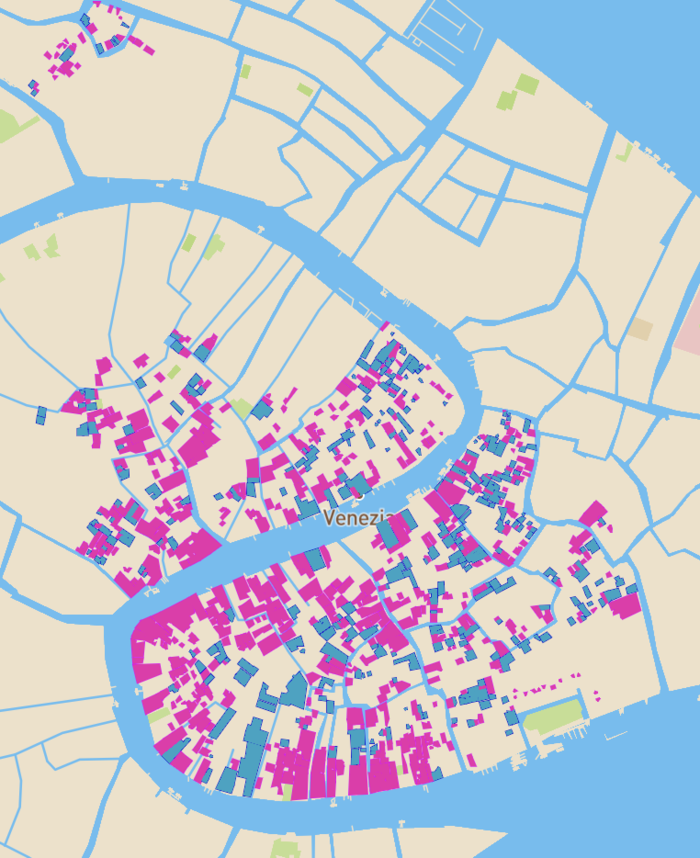
Additionally, we show where these changes took place. In the plot below the pink parcels of land show locations that remained the same, and blue shows locations that converted (mostly to shops). We find that there tend to be “commercial clusters”, areas that were converted on mass.
Figure 6: Geographic illustration of the change in property type between the two periods.
A Venetian Victory
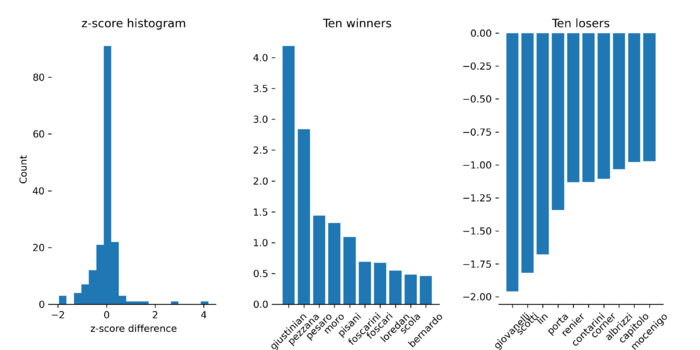
Now we turn to tackling the question, which families rose and fell during the period? To tackle this we use the total area as a measure for growth. If a family began to own a more land, then they are considered hot and if they lose a lot of land. To begin, we were interested in the Gini coefficient between the two periods. The Gini coefficient is a measure of how equitably dispersed something is across groups. This is often used in economics as a measure of equality of weath. In our case, we are interested to see how did the power dynamics changed in the center of Venice between 1748 and 1808. We find that the Gini coefficient increased from 0.63 to 0.68. This means that in general, area got more concentrated in the hands of a few. This being said, who were these hands and how did they change? Measuring total area is tricky since it might lose track of “hot” families who gained a lot of land, but on a scale that doesn’t compete with the Contarini family, for example. To adjust for this, what we do is calculate the z-score for each families land ownership in the two periods and then take the difference in the z-scores. So if a family went from owning a lot of land to a little (in relation to the rest of the families) then the family would have a negative score, and vice-versa.
We begin by plotting the z-score difference in a histogram. In general, we find that most people stayed around the same, but a larger portion of people saw a decline. A few lucky families, however, experienced a large increase in area. The families that were hot are shown in the middle bar plot, and the families that suffered are shown in the right plot.
Figure 7: Change in family power captured by z-score.
Interesting, the Giustinian and Pezzana were the families that gained the most between the two periods, and the Giovanelli and Scotti lost the most between the two periods.
Quality assesment and limitations
- Removing the public institutions from the family datasets is a quality limitation, as we suspect our list not to be extensive. It was created while browsing through the dataset and adding all the public institutions we could find.
- Another limitation occurred when renaming the italian expressions. While it was an effective way to make the Cadaster and Catastici dataset compatible, the harmonization effort failed in some occasions.
- As the names of the families are ambiguous, we would ideally find a way to disambiguate them in future work. This might be done using other sources and digitalized datasets that might shine light on who's who.
- For our analysis we focused only on the areas for which we have both an entry in the Cadaster and in the Catastici dataset. This poses the probably biggest limitation to our research. However, this could easily be extended in future work, if the Catastici dataset was to be extended
Conclusion
In this work we present a method for augmenting existing historical studies through the use of digitalized archives. We paint two pictures of Venice, each based on similar features, and then compare the pictures through time. The static images reveal family dynamics, the land composition, and let’s us quantify nobility and status in a society where the two of immense importance. Moreover, the comparison permits the tracking of how macro changes took place in Venice.
| Date | Task | Completion |
|---|---|---|
| Week 5 |
|
✓ |
| Week 6 |
|
✓ |
| Week 7 |
|
✓ |
| Week 8 |
|
✓ |
| Week 9 |
|
✓ |
| Week 10 |
|
✓ |
| Week 11 |
|
✓ |
| Week 12 |
|
✓ |
| Week 13 |
|
✓ |
| Week 14 |
|
X
✓ |
Links
Github repository: https://github.com/vminvsky/FDH_project.git
