Paintings / Photos geolocalisation: Difference between revisions
Junhong.li (talk | contribs) |
Junhong.li (talk | contribs) |
||
| Line 35: | Line 35: | ||
===Data collection=== | ===Data collection=== | ||
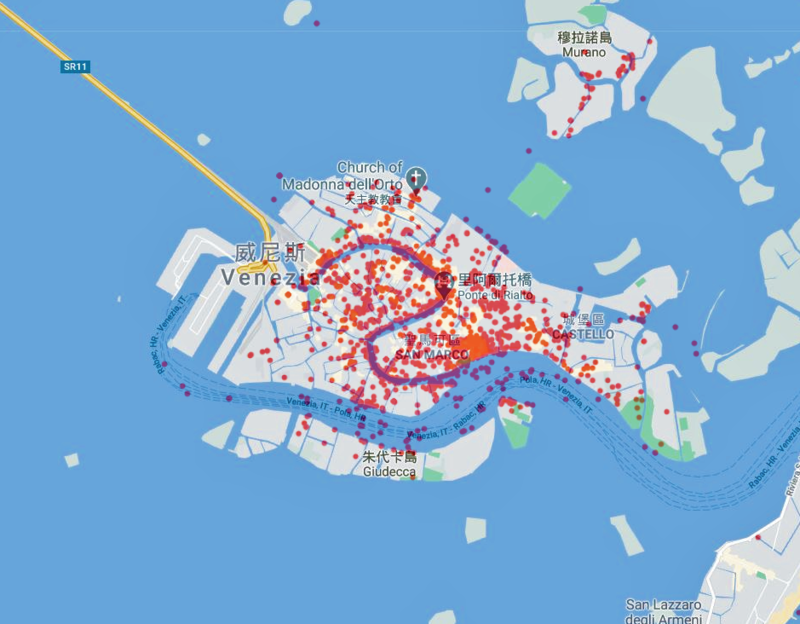
We use flickrapi to crawl photos with geo-coordinates of Venice. And finally we get 2387 images. | We use flickrapi to crawl photos with geo-coordinates of Venice through Flickr. And finally we get 2387 images. | ||
[[File:Location of the images.png|800px|]] | [[File:Location of the images.png|800px|]] | ||
Revision as of 14:00, 9 December 2020
Introduction
Planning
| Date | Task |
|---|---|
| By 08.Nov. | Determine the method to be used and obtain the dataset |
| By 14.Nov. | Get result of SIFT method and evaluate the result |
| By 22.Nov. | Use deep learning methods to obtain preliminary results |
| By 29.Nov. | Finalize result of deep learning and try improvements |
| By 06.Dec. | Implement web using Django framework |
| By 10.Dec. | Final report writing |
| By 15.Dec. | Final result and presentation |
Methodology
Data collection
We use flickrapi to crawl photos with geo-coordinates of Venice through Flickr. And finally we get 2387 images.
SIFT
SIFT, scale-invariant feature transform, is a feature detection algorithm to detect and describe local features in images. We try to use this method to detect and describe key points in the image to be geolocalised and images with geo-coordinates. With these key points, we can find the most similar image and then finish the geolocalisation.
- Dataset spliting
To check the feasibility of our method, we try to use images with geo-coordinates to test. Therefore, we should split our dataset into testing dataset(to find geo-coordinates) and matching dataset(with geo-coordinates). In our experiment, because we do not have a dataset large enough and the matching without parallel is time-consuming, we randomly choose 2% of the dataset to be test dataset.
- Scale-invariant feature detection and description
We should firstly project the image into a collection of vector features. The keypoints defined thoes who has local maxima and minima of the result of difference of Gaussians function in the vector feature space, and each keypoint will have a descriptor, including location, scale and direction. This process can be simply completed with the python lib CV2.
- Keypoints matching
To find the most similar image with geo-coordinates, we do keypoints match for each test image, finding the keypoint pairs with all images in the matching dataset. Then, calculating the sum distance of top 50 matched pairs' distance. We choose the image with the smallest sum distance as the most similar image and give its geo-coordinates to the test image.
- Error analysis
For each match-pair, we calulate the MSE(mean square error) of lantitude and longitude. In order to assess our result, We try to visualise the distribution of MSE and give a 95% CI of median value of MAE by bootstrapping.
