Generation of Textual Description
Introduction
Leveraging two invaluable historical datasets - the 1740 Catastici and the 1808 Sommarioni - our project aim to generate detailed textual descriptions of parcels in Venice. These datasets, rich in historical, spatial, and social information, provide a comprehensive view of land ownership, urban development, and social structure in Venice across two distinct periods. The 1740 Catastici offers early insights into parcel functions, rent payments, and tenant names, while the 1808 Sommarioni provides a more detailed and standardized survey, including owner data, and normalized ownership types and qualities. By integrating these datasets, we can create informative descriptions of each parcel, including their location, function, ownership details, and historical context, thereby enhancing our understanding of Venice's evolution and cultural significance.
Motivation
Our motivation for utilizing the 1740 Catastici and 1808 Sommarioni datasets stems from the rich historical insights they offer, despite the challenges in comprehending and connecting the data. These datasets, like many other historical records, face significant challenges in terms of data consistency and coherence. The data, often unstructured and manually constructed, presents inconsistencies due to its varied and sometimes incomplete nature. Fields may be missing, mistranscribed, or contain varying levels of detail, making it difficult to connect the different pieces of information into a coherent narrative. Additionally, the use of old Italian and Venetian dialects can further complicate the interpretation and context of the data.
Given these challenges, especially for non-historians, our goal is to simplify and contextualize this complex information. By cleaning, organizing, and integrating the data from these datasets, we aim to create coherent and informative textual descriptions. Leveraging in-context learning and prompting with GPT-4, we seek to depict a clear description of the story behind each datapoint, making the historical narratives more accessible and understandable for a broader audience. This approach will not only facilitate a deeper understanding of Venice's history but also make the datasets more user-friendly and interpretable.
Deliverables
- Pre-processed, standardized dataset from the original source
- A manually-crafted dictionary of old Venice house functions, matching terms used in the dataset with translations and detailed historical description
- A text generation pipeline using in-context learning methods
- A set of evaluation metrics to assess the text generation pipeline across different perspectives
Project Timeline & Milestones
| Timeframe | Task | Completion |
|---|---|---|
| Week 4 |
|
✓ |
| Week 5 |
|
✓ |
| Week 6 |
|
✓ |
| Week 7 |
|
|
| Week 8 |
|
|
| Week 9 |
|
|
| Week 10 |
|
|
| Week 11 |
| |
| Week 12 |
|
|
| Week 13 |
|
|
| Week 14 |
|
Methodology
Data Exploration
Data clusterings and patterns
[Nas's part of detecting the different common/uncommon formats]
Data Enrichment
Functionality of Parcels
[Nas's part of processing the functionality and creating dictionary]
Standardization of Monthly Rent
Exploring Value Formats
Inferring accurate values from rent data can offer valuable insights into a parcel's history, such as its price in relation to its neighborhood, which may reflect its relative status at that time. Among 35,946 data rows, we identified that only 28,610 (~80%) contained numeric values, with the remaining entries consisting of null values or text data.
Upon exploration, we encountered examples of text data such as:
'10 ducati, 19 grossi' '40 ducati e 14 grossi' 'casa in soler'
'libertà di traghetto' '20 lire' '26 lire' '15 lire'...
These examples illustrate the diversity of information present in the text entries, including multiple currencies, descriptive text about the parcel’s function, and potential typographical errors.
To standardize the non-numeric rent values, we developed an iterative approach. Using regular expressions (regex), we captured patterns within the data. After each iteration, we matched the patterns against the dataset, identified any emerging new patterns, and incorporated them into our existing pattern set. This process was repeated until no new patterns could be found.
In the final iteration, we identified six main patterns as follows:
| Pattern Name | Example | Notes |
|---|---|---|
| Single currency | 30 lire | with optional "de piccoli" or "di piccoli" |
| Dual currency | 7 ducati, 18 grossi | with optional "de piccoli" or "di piccoli" |
| Three-part currency | 10 ducati, 2 lire, 8 soldi | |
| Fractional or "e mezzo" units | 8 ducati e mezzo | |
| Time-related mentions | al mese, ogni tre mesi, per metà | |
| Function or Ownership | casa, bottega | |
| Others | 1[5], 1' | Unmatched with any of the above |
Format Selection and Hypothesis
From the identified text formats, we decided to exclude entries related to function, ownership, or other non-monetary details due to uncertainty about their origins. These deviations may stem from transcription errors or the inclusion of special characters.
For analysis, we focused on the remaining matched patterns, which revealed a mix of currencies within the entries. We identified five currency types used:
- Ducati/ducato [basis currency]
- Lire/lira/libre
- Grossi/grosso
- Soldi
To standardize the dataset, we made the following assumptions:
- Currency synonyms: Terms like ducati and ducato refer to the same currency, as do lire, lira, libre, and grossi/grosso.
- Default currency: If no currency is mentioned, it defaults to ducati.
- Irrelevant qualifiers: Phrases like de piccoli or di piccoli are ignored in numeric contexts. For example, 50 lire is treated the same as 50 lire di piccoli. Historically, "lire di piccoli" referred to a monetary unit based on the piccolo, a base coin in Venice, but not a distinct currency itself.
- Exchange rate: Based on Wikipedia, we use the following conversion:
- 1 ducati = 6.2 lire = 24 grossi = 124 solid
- While exchange rates were historically dynamic and context-dependent, we adopted this commonly cited, publicly available rate.
- Unmatched formats: Entries that do not align with the identified currency patterns are excluded from analysis and marked as
-1due to uncertainty (e.g., transcription errors or unclear historical context).
Standardization Strategy
We standardized all values by converting them to the smallest unit (soldi):
- Numeric values: Convert from ducati to soldi
- Non-numeric values:
- Matched format: Standardize as below
- Unmatched format: Ignore (no analysis)
Value Standardization Method
- Single currency: For entries like 30 lire, convert directly using the chosen exchange rate.
- Dual currency: For entries like 7 ducati, 18 grossi, separate the components, convert each, and combine the results.
- Three-part currency: For entries like 10 ducati, 2 lire, 8 soldi, follow the same process as dual currency but account for the third component.
- Fractional units: For entries like 8 ducati e mezzo or 8 e mezzo, treat e mezzo (and similar terms) as +0.5, then convert.
- Time-related mentions:
- al mese = "monthly" (standard conversion).
- ogni tre mesi = "every three months" (divide by 3).
- per metà = "for half" (divide by 2; likely indicates partial or shared payment responsibility). For example, 36 lire per metà translates to 18 lire each for two parties or simply half of 36 lire.
- per 3 mesi = "for 3 months" (remain as is; indicates a fixed three-month payment).
This process results in a new dataset column, std_rent, which contains standardized monthly rent values in soldi. A few samples of the result is shown as below:
| an_rendi | std_rent |
|---|---|
| 30 | 3720.0 |
| 30.5 lire di picolli | 189.1 |
| 7 ducati, 18 grossi di piccolo | 1300.0 |
| 10.0 ducati, 2 lire, 8 soldi | 1260.4 |
| 30 lire per mezzo | 189.1 |
| 40 lire al mese | 248.0 |
Adding Mean District Rent Value for Parcels
With the standardized rent values for each parcel, we extended our analysis to compare individual parcels against the mean rent value of their respective districts (sestiere).
During this process, we identified additional anomalies, such as values with more than four digits. Upon verification, these entries were recognized as transcription errors, likely due to confusion with the ID field. Such values were excluded from further analysis.
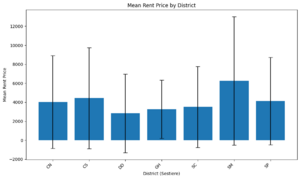
To compute the mean rent price for each district, we excluded both the invalid entries and the standardized -1 values, as defined earlier. The results are visualized in the following graph:
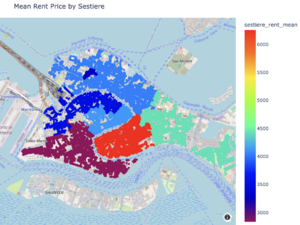
We further visualized the mean district rent values on a map, utilizing geographic coordinates to explore spatial patterns and gain insights into neighborhood characteristics and rent distributions.
From this visualization, we can derive interesting insights about neighborhoods. For example, San Marco (SM) has the highest mean rent, likely due to its central location within the city. This information enables further enrichment for text generation, not only within individual districts but also for comparisons across districts, offering a richer understanding of the socio-economic dynamics of the city.
Results
Limitations and Future Work
While this project has established a comprehensive pipeline for enriching data and generating textual descriptions, there are several areas where future work can enhance the quality and depth of the results:
- Further data standardization': Currently, we have only standardized the rent column due to its identified frequent patterns. However, there are additional unstandardized text fields that could provide valuable information, such as the quantity or quality of income. Further standardization of these fields could infer more detailed insights into owners' or tenants' social and economic status.
- Handling uncertain data: At present, we ignore data attributes that do not satisfy certain predetermined formats. Future work could involve taking extra steps to handle these uncertain cases, such as manual checks to verify accuracy, or developing additional strategies for interpretation through hypotheses or further processing (for instance, we ignore very high rent values (5 or 6-digit) for them being the outliers of our data - but was that true or there were these exceptional parcels that are highly expensive due to certain economical situation?)
- Deepening the connection between Catastici and Sommarioni: We have demonstrated the changes in parcel functions between the Catastici and Sommarioni datasets, which offer historical and economic insights. However, the Sommarioni dataset contains more potential information that requires deeper exploration. For instance, the detailed owner information, including family relationships, titles, and parcel ownership, can be used to detect interesting inheritance patterns (e.g., whether a parcel was inherited from father to son or grandson). This could significantly enhance the summarization text by providing a more nuanced understanding of historical and economic shifts.
- Extensive model testing and comparative analysis: Due to monetary constraints, we only tested GPT-4 on a subset of samples. Future work should involve refining the pipeline and running the final version over the entire dataset. Additionally, testing with different models and conducting a comparative analysis using existing or new evaluation metrics would provide a more critical and comprehensive assessment of the results. This approach would help in identifying the most effective model and fine-tuning the pipeline for optimal performance.
By addressing these limitations, future work can further enrich the data, improve the accuracy of the generated texts, and provide a more comprehensive understanding of the historical and economic context of Venice during these periods.
Conclusion
Github Repository
Credits
Course: Foundation of Digital Humanities (DH-405), EPFL
Professor: Frédéric Kaplan
Supervisors: Alexander Rusnak, Tristan Karch, Tommy Bruzzese
Authors: Nastaran Hashemisanjani, Fawzia Zeitoun, Bich Ngoc (Rubi) Doan

