Deciphering Venetian handwriting
Introduction
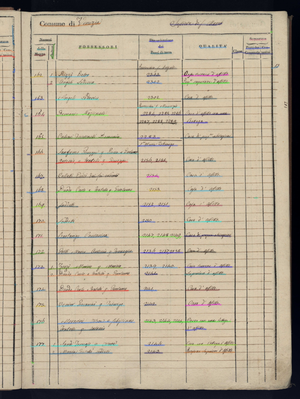
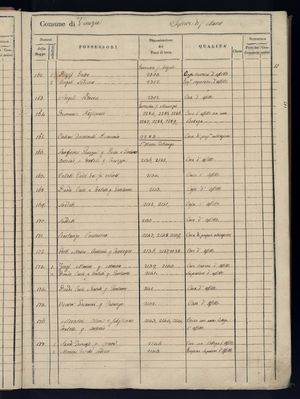
The cadasters are essential documents which describe the land reliably and precise manner. The shape of the lots, buildings, bridges, and layout of other urban works are meticulously documented and annotated with a unique number. The "Sommarioni" are the key to reading the map as they contain the parcel number (ref to the map), owner's name, toponym, intended use of the land or building, surface area of the land. The Napoleonic cadaster is an official record of the entire French empire. On the 15th of September 1807, a new law gave the order that the French Empire is to be meticulously measured and documented. This allowed the government to tax their subjects for the land that they owned. 1
These documents now allow historians to research the evolution of the city. The cadaster that this project will focus on is the Venetian cadaster created between 1807 and 1816 as a result of the law previously mentioned.
These documents are a very usefull source of information for historians studying these periods of history. To help them in this task, large amounts of historical documents have been dititalized in the scope of the Venice Time Machine project. The "Sommarioni" have been the focus of previous projects that have focused on manually digitalizing the content of these records. Sadly will doing this process the link to the page that contained the information was lost. A previous attempt to reestablish this link was done in the Mapping Cadasters, DH101 project. The motivation of this project was to attempt to improve the result that they obtained by trying a new approach.
The goal of this project is to create a pipeline that allows reestablishing the mapping between the digital scans of the "Sommarioni" and the digital version of it as an excel spreadsheet. To produce this pipeline, a mix of a deep neural network for handwriting recognition, a cycleGAN to extract patches, and classical image processing technics, and unsupervised machine learning.
Planning
| Week | Task |
|---|---|
| 09 | Segment patch of text in Sommarioni : (page id, patch) |
| 10 | Mapping transcription (excel file) -> page id (proof of concept) |
| 11 | Mapping transcription (excel file) -> page id (on the whole dataset) |
| 12 | Depending of the quality of the results : improve the mapping of page id, more precise matching, viewer web |
| 13 | Final results, final evaluation & final report writing |
| 14 | Final project presentation |
Week 09
- Input : Sommarioni images
- Output : Patch of pixels containing text with coordinate of the patch in the Sommarioni
- Step 1 : Segment hand written text regions in Sommarioni images
- Step 2 : Extraction of the patches
Week 10
- Input : transcription (Excel File), tuples (page id, patch) extracted in week 9
- Output : line in the transcription -> page id
- Step 1 : HTR recognition in the patch and cleaning : (patch, text)
- Step 2 : Find matching pair between recognized text and transcription
- Step 3 : New excel file with the new page id column
Week 11
- Step 1 : Apply the pipeline validated on week 10 on the whole dataset
- Step 2 : Evaluate the quality and based on that decide of the tasks for the next weeks
Week 12
- Depending of the quality of the matching
- Improve image segmentation
- More precise matching (excel cell) -> (page id, patch) in order to have the precise box of each written text
- Use an IIF image viewer to show the results of the project in a more fancy way
Methodology
The project can be summarized as a 4 steps pipeline as shown on figure TODO figue pipeline.
Step 1 - Text detection
The first part of the project consists in extracting the areas on the image of the page that contains the text. This is a required step since our handwriting recognition model requires as an input a single line of text. To extract the patches the first step is to identify the location of the text on the page. This information will be stored in the standard image metadata description called PAGE. The location will be stored by storing the baseline under some text. To extract the baseline we use the P2PaLA repository. It is a Document Layout Analysis tool based on the pix2pix and CycleGAN. More information on the network being used can be found in the Unpaired Image-to-Image Translation using Cycle-Consistent Adversarial Networks paper. Since there is no ground truth for the locations of baselines in the Sommarioni dataset we used the pre-trained model provided with P2PaLA. We do not have a metric to measure the quality of this step of our pipeline. We conducted a qualitative visual inspection of results. The output is remarkably good given that it was not trained on data from this dataset. A few false positives were found, but no false negatives. False positices are not an issue since the next steps in our pipeline will remove most of them.
Step 2 - Patch extraction
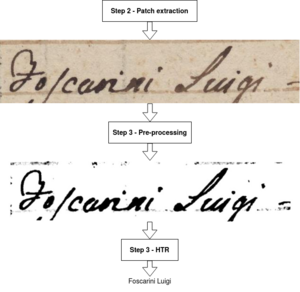
Once the baselines are identified we need to extract the areas that contained text (cropping the image of the page to contain only a single sentence). No preexisting tool satisfied the quality requirements that we require. Therefore, we created PatchExtractor. PatchExtractor is a python program that extracts the patches using as input the source image and the baseline file produced by P2PaLA. PatchExtractor uses some advanced image processing to extract the columns from the source image. The information about the column that the patch is located in, is crucial. After HTR we can use the location information to match the columns of the spreadsheet with their equivalent column in the picture.
A Hough transform was considered and tested as a potential method to extract the vertical lines but to many issues with filtering the lines produced showed up. No usefull information could be used from this approach.
Using a simple pixel mask is sufifcient and avoids issues with geometric distortions caused by the page shape while being scanned.
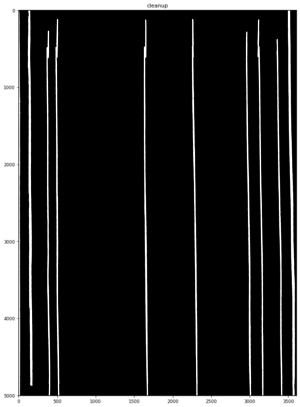
The advanced column extractor can produce a clean binary mask of the location of the columns as seen in Fig. 3. To achieve this multiple steps including some such as:
- Applying a Gabor kernel (linear feature extractor)
- Using a contrast threshold (Binary and Otsu)
- Gaussian blur
- Affine transformations
- Bit-wise operations
- Connected component size filtering (removing small connected components)
- Cropping
were done to transform the original picture into a column mask of the region of interest (ROI). The ROI is the part of the page that contains the text without the margins. We extract the ROI from the coordinates produced with P2PaLA.
This mask is then used to identify which column a baseline is in.
There is an extra challenge that we can fix with the knowledge of the location of the columns. Sometimes the baseline detection detects a single baseline for 2 columns that are close to each other as can be seen in Fig. 4
With the knowledge of the location of the columns PatchExtractor fixes these issues and produces 2 distinct images as can be seen in Fig. 5
The output of PatchExtract will produce a patch per column and row containing text, as well as identifying to column in which the patch was extracted.
A possible area of reasearch that would probably increase the quality of the collumn extraction and patch numbering would be to train a Convolution Neural Net to identify the ROI. Using the location of the text patches is better than nothing but a know issue with this approach is that some scans contain part of the neighbouring page text. This will increase the size of the ROI to include the 2 pages and a line is usually detected at the seam between the 2. This is an unwatend side effect of this approach. Creating a training dataset for this task should be quite cheap in humman labor since the segmentation mask is very simple.
The resulting output can then begin the pre-processing for the HTR.
Step 3 - Handwritten Text Recognition
The third step of the pipeline is the handwritten text recognizer(HTR system. It takes as input the patches extracted during step 2 and produces the text.
The HTR is a deep learning model. The deep learning architecture chosen is the PyLaia architecture that is a mix of Convolutional and 1D recurrent layers based on "Are Multidimensional Recurrent Layers Really Necessary for Handwritten Text Recognition?" (2017) by J. Puigcerver [3].
We did not change the PyLaia architecture but we took it as a framework to train a new model. We first pre-train a model on the IAM dataset[5]. The IAM dataset is a gold standart dataset for HTR. Then we took the model as starting point to train on a specific dataset made from hand-written text from venice. This process is called transfer learning. To evaluate our models we used two standards metrics for HTR systems. We used the Word Error Rate (WER) and the Character Error Rate (CER).
We applied some pre-processing before feeding the patches to the HTR model. We used the pre-processing techniques that are used in PyLaia. The first thing is to enhance the image. It is done ba applying some traditional computer vision techniques to remove the background and clean the patches. Then we resize the patches in order that each patch have the same height.
Then we can feed the patches in our system. These pre-processing steps are used before training but also on the patched extracted in step 2 when we use the HTR. We save the output in csv files containing 2 columns : the name of the patch and the text recognized by the HTR.
Step 4 - Sommarioni matching
The fourth step consists of the actual matching. It takes as input the text recognized by the HTR with some data about the patch itself coming from the step 2 and the excel file containing the transcription. The goal of this step is to establish a mapping between the images and the excel file.
Challenges
The main challenges comes from the fact that there are errors and inconsistencies from every previous steps that we need to correct or mitigate. This is is during the implementation of this part that we really realized some special cases that are in the Sommarioni. The detected special cases are the following :
- Coverta, anteporta and incipit
- Blank tables : tables that contain no data.
- Special tables
The errors and inconsistencies from the previous steps are the following :
- Columns numbers errors (from step 2)
- HTR errors (from step 3)
- Patches do not contain a full cell of the table
During this step we also realized some facts in the transcription excel file :
- The Excel file is not completely sequential
- Register 7 is not transcripted in the Excel File
Data wrangling and cleaning
To handle those challenges we tried to clean the data and also correct/normalize the data that could be fixed based on a statistical analysis. Coverta, anteporta and incipit are simple to handle. The naming of the images of the Sommarionni allow us to just remove them and not take them into account. For the blank tables, the special tables and for the column numbers errors we take a statistical approach to handle them.
From step 2, we have the column numbers of each patch, and from step 3 we have string of characters for each patch. Taking those information we make feature vectors representing a page. The dimension of the feature vector is equal to the number of columns detected in the page. Each component is equal to the average length of the string of characters for this column in this page. The valid tables are really similar and the tables being a way to structure information, we can indeed see patterns in our representation of pages.
To analyse these feature vectors we visualized them using PCA. The PCA plot per register show us a big cluster. However, we are only able to clearly define two cluster. We tried several clustering algorithm and also different two projections techniques (PCA and tSNE). The valid cluster containing valid pages without column errors and another cluster of outliers spread in the space.
The blank page, special pages have clearly a different distribution of average string length per column. For error of columns this is more tricky to detect. The errors of columns are often a complete shift of the column. A shift to the right occurs when there is an extra column detected in the left of the image. This could be because in the photograph we can see something else in the left. A shift to the left is the opposite. It is when the first column detected is directly the first column of data.
We want to fix the shifted pages and then to be able to remove only the blank and special pages. We first cluster the features vectors in two cluster using KMeans algorithm. After this first step we iterate on the vectors that are in the cluster marked as outlier. We shift the vector to the left and to the right. We them observe if the shifted vectors is now in the correct cluster. If it is the case, we fix the column number for every patches of the page.
We wanted to fix the shifted pages because the column number is a very meaningful information for the actual matching. With those information can also clean the columns further. For example, we know that in the columns Numero della mappa and subalerno, there should be a number in principle.
Matching
The matching is a rule based matching where we iterate on the excel file. At each step of the iteration we look for the patches that contains the information of the Excel line. In the Sommarionni the columns Numero della mappa and Subalterno form a key. With perfectly aligned columns, perfect HTR and all patches containing text extracted, the actual matching will only be a look up of the patch containing the numero della mappa and the subalterno. We cannot assume that. We adopt the following strategy :
- Look for the numero della mappa in the text
Quality assessment
License
All contributions that we have done on the project have been granted a MIT license.
