Widows in Venice
rent analysis
Research Question : What is the economical situation of widows in Venice in 1740 ?
Widows in the catastici are always either tenants or owners of a place. About 10% of widows own or rent multiple properties. We will focus on analyzing the rent of properties rented by widow and the rent of properties owned by widows.
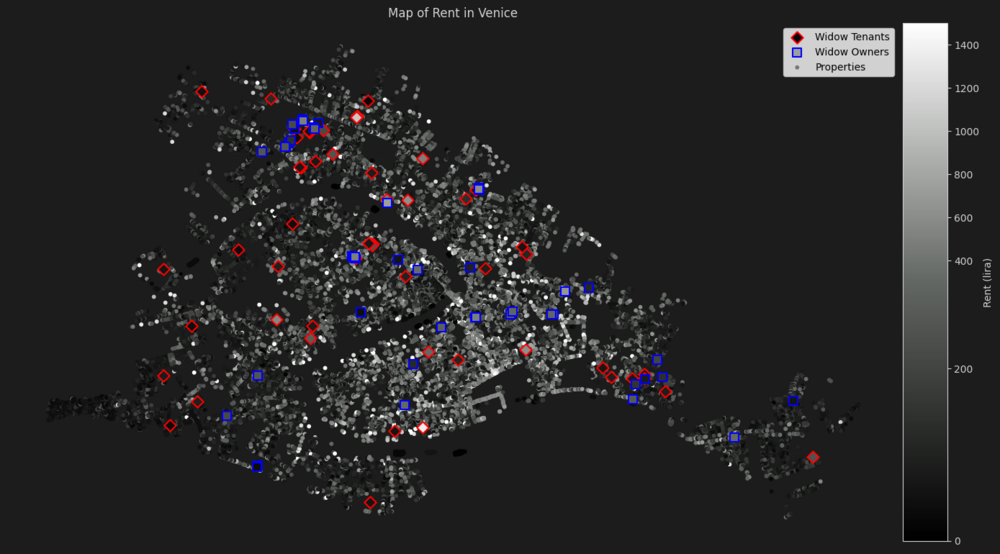
The scale of Venice
When looking the entire city of Venice, we find a very small 103 properties in which widows are involved, from a total of 30k. This is about 0.3% of the properties of the catastici. We could expect this number to be closer to 15%. We are identifying the widows with keywords (consorte and vedova), so it is possible that some widows are mentioned with their name only, making them indistinguishable from unmarried women. Also, we are ignoring cases where we have no rent information. Nevertheless, if we assume that our sample is representative of the widows in Venice, we clearly see that when renting, widows pay about 40 lirae less than median rent per property and when owning a place, they earn about 40 lirae more than median rent per property. Those difference represent a 30% difference to median rent.
A possible explanation for widows renting at lower price would be that they get discounts due to their social status. But, their rent with money (whereas sometimes people pay with other goods) and there is no mention to a widow not paying and living out of someone's charity, which is the case for other people in Venice. Also, this type of positive discrimination towards widows wouldn't explain why widows own properties that are rented at a higher price.
| Median Rent | Widow Owners Median Rent Difference | Widow Tenants Median Rent Difference | Properties | Widow Owned Properties | Widow Rented Properties |
|---|---|---|---|---|---|
| 124.0 | + 37.2 | - 37.2 | 29999 | 48 | 55 |
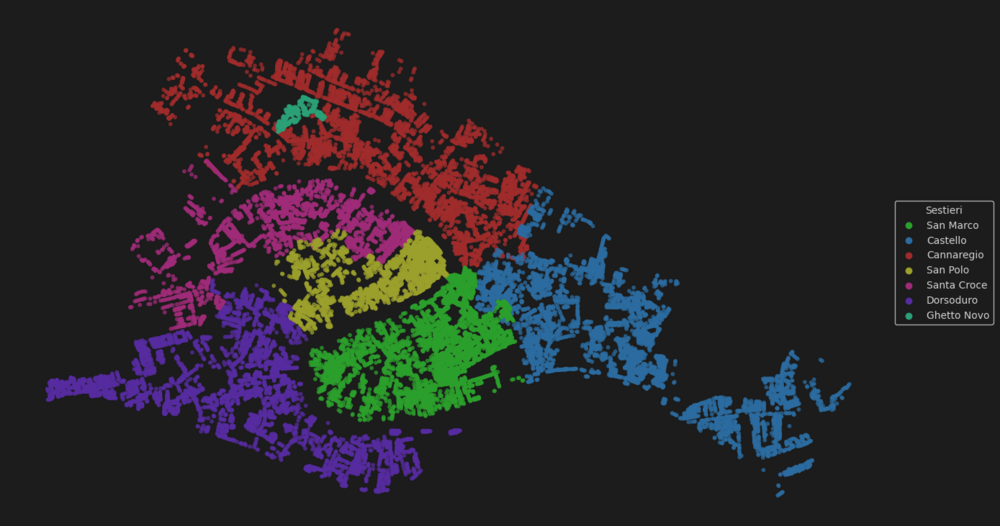
The scale of the districts
If the price difference is not explained by positive discrimination, it means that widows that own properties own above average properties and widow tenants rent below average properties. But this asked further questions: Are those properties located in specific cheap or expensive neighborhoods ? Where are widows renting ? Where do hey own properties ? And are we sure that what we observe at the macro level of the city still holds at more micro levels ?
If we zoom in to the scale of districts, we realize that the proportion of widow owners and tenant from the Ghetto is very high compare to other districts. This is a clear hint that widows
| District | Widow owners | Widow tenants | Combined |
|---|---|---|---|
| San Marco | 0.09% | 0.07% | 0.16% |
| Castello | 0.24% | 0.14% | 0.38% |
| Cannaregio | 0.10% | 0.33% | 0.43% |
| San Polo | 0.10% | 0.10% | 0.20% |
| Santa Croce | 0.15% | 0.31% | 0.46% |
| Dorsoduro | 0.07% | 0.08% | 0.15% |
| Ghetto | 2.08% | 0.94% | 3.02% |
Despite the high variations in rent between districts, the pattern of owners owning more than median rent and tenants renting at lower prices holds in almost every district.
| Sestiere | Median Rent | Widow Owners Median Rent Difference | Widow Tenants Median Rent Difference | Properties | Widow Owned Properties | Widow Rented Properties Size |
|---|---|---|---|---|---|---|
| San Marco | 210.8 | + 37.2 | 0.0 | 5697 | 5 | 4 |
| Castello | 124.0 | + 99.2 | - 43.4 | 5774 | 14 | 8 |
| Cannaregio | 124.0 | + 55.8 | - 6.2 | 6016 | 6 | 20 |
| San Polo | 142.6 | + 24.8 | - 43.4 | 2930 | 3 | 3 |
| Santa Croce | 111.6 | - 12.4 | - 37.2 | 3218 | 5 | 10 |
| Dorsoduro | 86.8 | + 40.3 | - 24.8 | 5835 | 4 | 5 |
| Ghetto Novossimo | 124.0 | + 24.8 | - 62.0 | 529 | 11 | 5 |
The scale of the parishes
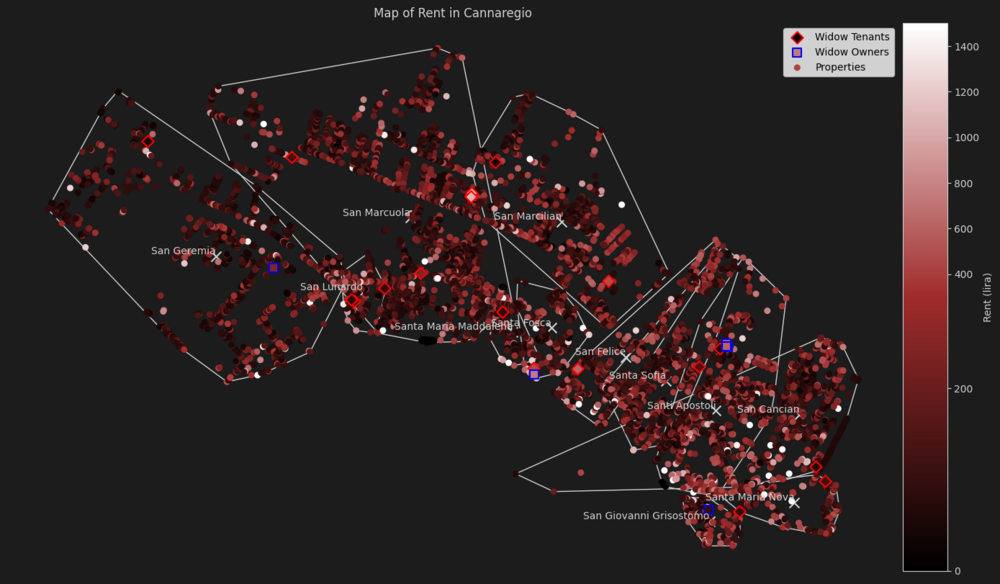
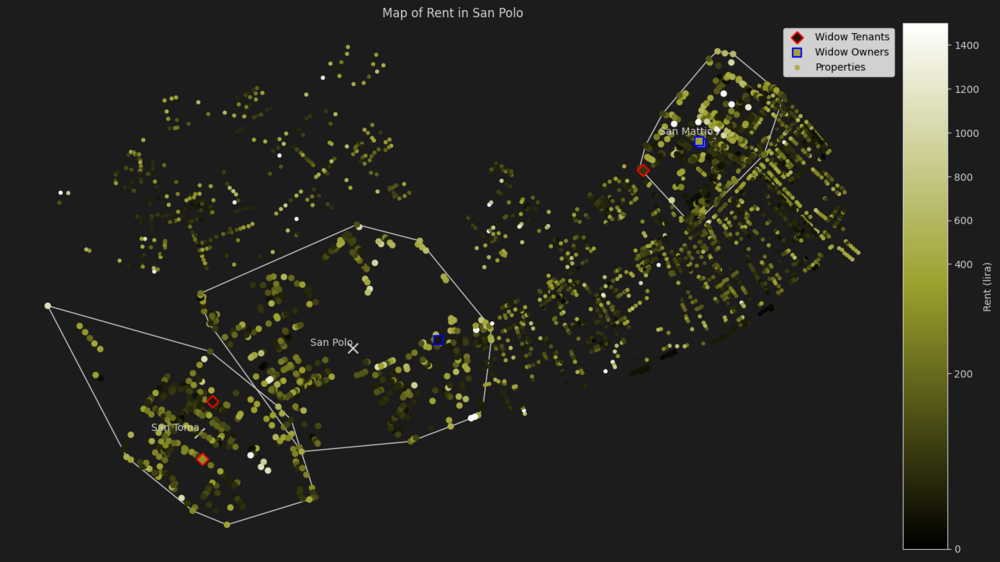
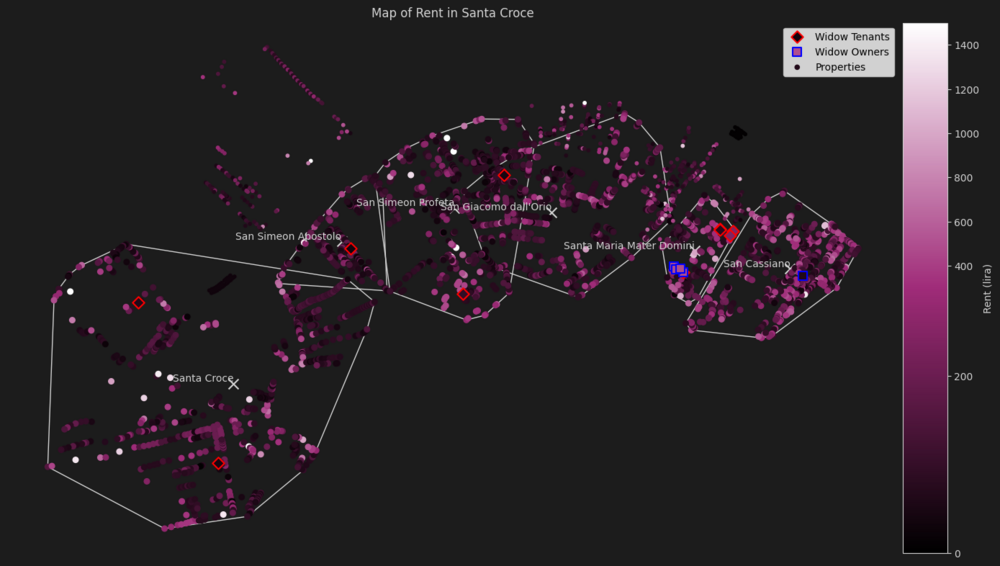
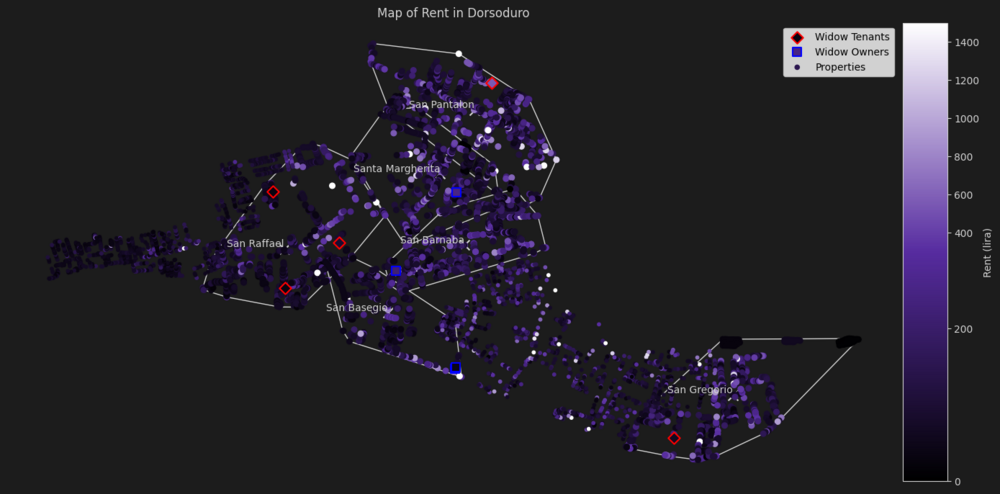
To say, more about each district, it is useful to look into each of them separately. For each district, we can identify the parishes in the district in which widows are involved. Parishes are most of the time very geographical, but people don't always belong to the parish closest to where they live. In the following plots, parishes are represented by a line encircling all of it's members. Sometimes, non members happen to fall inside the parishe's shape despite not belonging to it. To be able to visualize this case, properties not belonging to the widows parishes are shown with a smaller diameter.
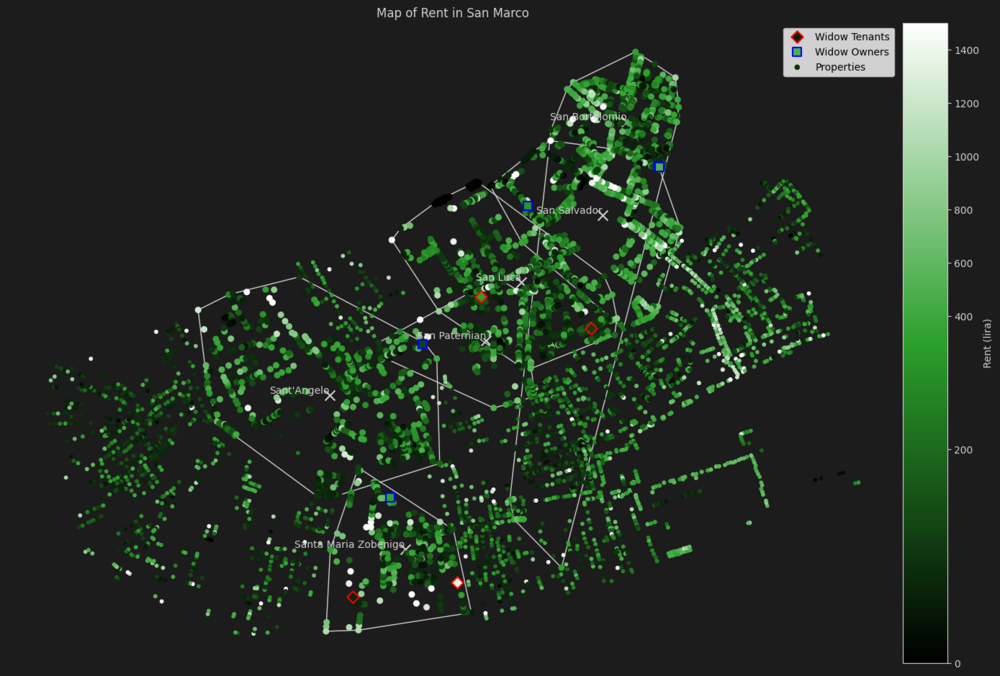
San Marco
| Parish | Median Rent | Widow Owners Rent Median Difference | Widow Tenants Rent Median Difference | Properties | Widow Owned Properties | Widow Rented Properties Size |
|---|---|---|---|---|---|---|
| San Bortolomio | 223.2 | + 24.8 | - | 503 | 2 | 0 |
| San Luca | 161.2 | - | -49.6 | 503 | 0 | 1 |
| San Paternian | 186.0 | - | + 124.0 | 178 | 0 | 1 |
| San Salvador | 272.8 | 5.2 | - | 521 | 1 | 0 |
| Sant'Angelo | 186.0 | -62.0 | - | 506 | 1 | 0 |
| Santa Maria Zobenigo | 183.4 | + 126.6 | + 529.6 | 256 | 1 | 2 |
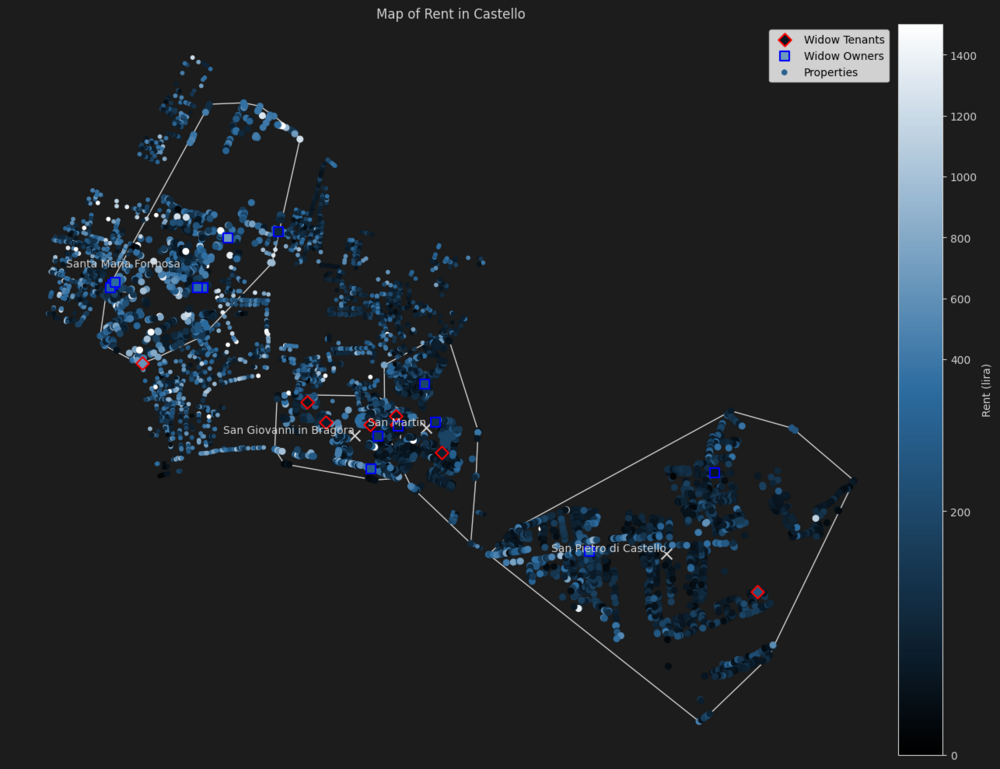
Castello
| Parish | Median Rent | Widow Owners Rent Median Difference | Widow Tenants Rent Median Difference | Properties | Widow Owned Properties | Widow Rented Properties Size |
|---|---|---|---|---|---|---|
| San Giovanni in Bragora | 124.0 | + 84.3 | -52.7 | 399 | 2 | 4 |
| San Martin | 86.8 | + 49.6 | -6.2 | 563 | 3 | 2 |
| San Pietro di Castello | 99.2 | + 86.8 | + 142.6 | 1495 | 2 | 1 |
| Santa Maria Formosa | 186.0 | + 62.0 | + 434.0 | 747 | 7 | 1 |
Cannaregio
| Parish | Median Rent | Widow Owners Rent Median Difference | Widow Tenants Rent Median Difference | Properties | Widow Owned Properties | Widow Rented Properties |
|---|---|---|---|---|---|---|
| San Cancian | 124.0 | - | -62.0 | 629 | 0 | 1 |
| San Felice | 186.0 | - | + 434.0 | 351 | 0 | 1 |
| San Geremia | 99.2 | + 148.8 | -49.6 | 1082 | 1 | 1 |
| San Giovanni Grisostomo | 186.0 | -86.8 | - | 187 | 1 | 0 |
| San Lunardo | 148.8 | - | -74.4 | 117 | 0 | 3 |
| San Marcilian | 124.0 | - | + 136.4 | 589 | 0 | 2 |
| San Marcuola | 117.8 | - | + 83.7 | 1432 | 0 | 6 |
| Santa Fosca | 124.0 | + 620.0 | + 347.2 | 163 | 1 | 1 |
| Santa Maria Maddalena | 124.0 | - | -37.2 | 119 | 0 | 1 |
| Santa Maria Nova | 198.4 | - | -99.2 | 183 | 0 | 2 |
| Santa Sofia | 136.4 | - | 0.0 | 546 | 0 | 1 |
| Santi Apostoli | 161.2 | -49.6 | -99.2 | 618 | 3 | 1 |
San Polo
| Parish | Median Rent | Widow Owners Rent Median Difference | Widow Tenants Rent Median Difference | Properties | Widow Owned Properties | Widow Rented Properties |
|---|---|---|---|---|---|---|
| San Mattio | 136.4 | + 31.0 | -37.2 | 319 | 2 | 1 |
| San Polo | 161.2 | -117.8 | - | 353 | 1 | 0 |
| San Toma | 136.4 | - | + 24.8 | 272 | 0 | 2 |
Santa Croce
| Parish | Median Rent | Widow Owners Rent Median Difference | Widow Tenants Rent Median Difference | Properties | Widow Owned Properties | Widow Rented Properties |
|---|---|---|---|---|---|---|
| San Cassiano | 186.0 | -124.0 | - | 546 | 1 | 0 |
| San Giacomo dall'Orio | 99.2 | - | -55.8 | 657 | 0 | 1 |
| San Simeon Apostolo | 99.2 | - | -62.0 | 198 | 0 | 1 |
| San Simeon Profeta | 93.0 | - | 0.0 | 447 | 0 | 1 |
| Santa Croce | 111.6 | - | -58.9 | 739 | 0 | 2 |
| Santa Maria Mater Domini | 124.0 | + 3.1 | -31.0 | 152 | 4 | 5 |
Dorsoduro
| Parish | Median Rent | Widow Owners Rent Median Difference | Widow Tenants Rent Median Difference | Properties | Widow Owned Properties | Widow Rented Properties |
|---|---|---|---|---|---|---|
| San Raffael | 74.4 | - | -43.4 | 772 | 0 | 3 |
| San Barnaba | 124.0 | + 93.0 | - | 904 | 1 | 0 |
| San Basegio | 74.4 | -37.2 | - | 359 | 2 | 0 |
| San Gregorio | 86.8 | - | -24.8 | 487 | 0 | 1 |
| San Pantalon | 111.6 | - | + 446.4 | 639 | 0 | 1 |
| Santa Margherita | 99.2 | + 148.8 | - | 483 | 1 | 0 |
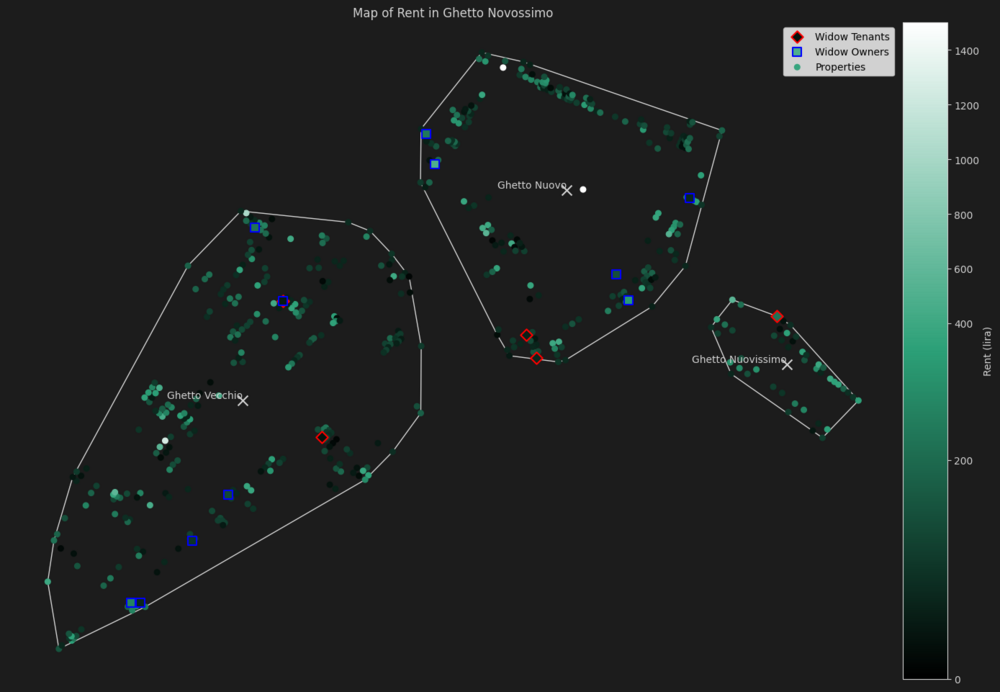
The Ghetto
| Parish | Median Rent | Widow Owners Rent Median Difference | Widow Tenants Rent Median Difference | Properties | Widow Owned Properties | Widow Rented Properties |
|---|---|---|---|---|---|---|
| Ghetto Nuovissimo | 148.8 | - | + 68.2 | 46 | 0 | 1 |
| Ghetto Nuovo | 124.0 | + 105.4 | -55.8 | 207 | 5 | 2 |
| Ghetto Vecchio | 124.0 | -6.2 | -80.6 | 276 | 6 | 2 |