A century in Beijing
Jump to navigation
Jump to search
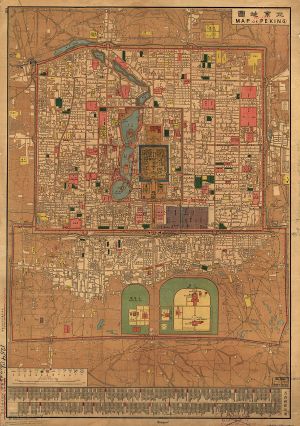
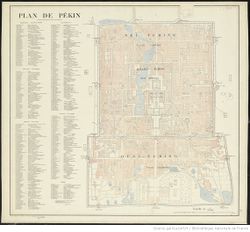
Using this map by France's Service Géographique de l'Armée from 1900 we will follow the evolution of the urban landscape of the central part of China's capital at several milestones through the decline of Qing dynasty, the birth of a republic, the establishment communism to the modern times. The city grew vey quickly over the last hundred years and is now way past its old borders. While some things in the downtown remained pretty unchanged like the Tiananmen Imperial Palace, numerous old constructions were demolished in an effort to modernize the town.
Outline
Sources
Goals
- To align maps from different time periods and see how the landscape changed. The town's straightforward rectangular planning will allow us to make matches more easily.
- Incorporating the geodata for finding places.
- The map has a rich legend with toponymic information in French and the dated French system of transliteration of Mandarin. The plan is to extract and match these place names with their modern counterparts.
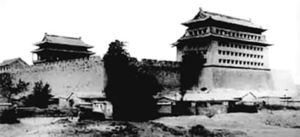
- Add the old pictures of significant buildings that are no longer there if it's possible to find them.
- To present the results as a web resource.
Tools
- Google Firebase – non-SQL web-based database
- QGIS – map alignment software
- Google Cloud OCR – text recognition tool
- HTML, JS etc. – basic standard web development instruments
Project plan
- Find a proper map that can be used to align and containing enough information.
- Align the old map with the mordern one.
- Compar these two maps and extract the area where building changed.
- Extract the coordinates of the old building.
- Creat a database to record the name, function of the old building and the name and function of the current one.
- Compar these two maps and extract the area where the function of building was changed.
- Extract the coordinates
- Creat a database to record the name, function of the old building and the address of the appartment currently.
- Crea a website which can display the difference of two maps in an interactive way.
- high light all the areas which were rebuilt or function have been changed in different colors.
- For the area which were rebuilt:When putting cursor on this area,pop up window to show the instruction of old buildings and the current one.
- For the buildings which function were changed:When putting cursor on this area,pop up window to show the function of these departments and hight light the area where the current dapartment is.
Milestones
| Timeframe | Task | Completion |
|---|---|---|
| Week 8 | ||
| 07-09.11 | Choosing tools for the map alignment | ✓ |
| Aligning the old map with the modern satellite map | ||
| Applying DH-segment to automatically extract street and buildings’ shapes | ||
| Using Google OCR to extract word description | ||
| Evaluating current results | ||
| Selection of more suitable old maps | ||
| Week 9 | ||
| 14-16.11 | Map alignment | ✓ |
| Preparation of the midterm presentation | ||
| Week 10 | ||
| 21-23.11 | Developing the database structure | |
| Extracting the building shapes from the old map | ||
| Planning for the development of a website with the map | ||
| Week 11 | ||
| 28-30.11 | Finishing all the extraction jobs | |
| Adding the data to the database | ||
| First version of the website | ||
| Week 12 | ||
| 05-07.11 | Adding interactive functions | |
| Finishing the website | ||
| Week 13 | ||
| 12-14.12 | Project report | |
Sections to be developed
- Outcome
- Code


