Paintings / Photos geolocalisation
Introduction
The goal of this project is to locate a given painting or photo of Venice on the map. In the final website we implement, user can upload an image, and the predicted location of the image will be shown on the map.
Motivation
Travelling is nowadays a universal hobby. There are many platforms like Instagram and Flickr for people to post their travel photos and share with strangers. With geo information of the posts provided by bloggers, other users can search pictures in a specific location and decide if they want to go travel there. But how about seeing an amazing picture without location indicated? We would like to address this problem in our project. We hope to come up with a solution that can locate an image on map so that if someone find a gorgeous picture without geo information, he or she can use our method to find the location of the place and plan a trip there.
Also, our method should work on realistic paintings, as the features in those painting should be similar as in photo. Therefore, art lovers can use our method to locate a painting and be in the painting themselves.
The scale is restricted to Venice in our project.
Project Plan and Milestones
| Date | Task | Completion |
|---|---|---|
| By Week 3 |
|
✓ |
| By Week 8 |
|
✓ |
| By Week 9 |
|
✓ |
| By Week 10 |
|
✓ |
| By Week 11 |
|
✓ |
| By Week 12 |
|
✓ |
| By Week 13 |
|
-- |
| By Week 14 |
|
Methodology
Data collection
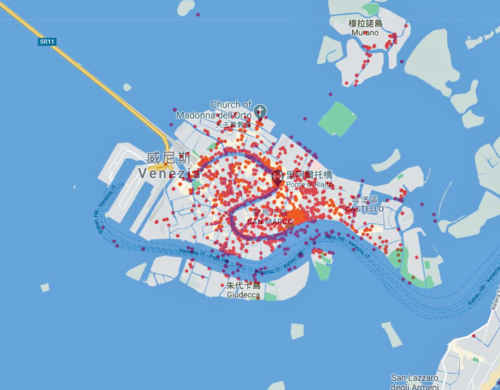
We use the python package flickrapi to crawl photos with geo-coordinates inside Venice from Flickr. In order to exclude the photos of events and human portrait that are taken in Venice, we set the key words to be "Venice, building". Since it is possible that the keyword "Venice" appear in photos taken in other place, we also set up a latitude and longitude region of Venice, returned photos with geo-coordinates outside this range will not be considered. After this step, we generate a text file containing the geo-coordinates of photos and URLs to the photos.
We repeat the first step for several times and realize that for each time, the number of returned images is different. We therefore processed our text files by deleting the duplicated images and merging them. Then, we use requests package to download collected images using the URLs we get from previous step, at the same time, we generate a label text file with geo-coordinates and corresponding image file names.
Finally, we get 2387 images of Venice buildings with geo-coordinates.
SIFT
SIFT, scale-invariant feature transform, is a feature detection algorithm to detect and describe local features in images. We try to use this method to detect and describe key points in the image to be geolocalised and images with geo-coordinates. With these key points, we can find the most similar image and then finish the geolocalisation.
- Dataset spliting
To check the feasibility of our method, we try to use images with geo-coordinates to test. Therefore, we should split our dataset into testing dataset(to find geo-coordinates) and matching dataset(with geo-coordinates). In our experiment, because we do not have a dataset large enough and the matching without parallel is time-consuming, we randomly choose 2% of the dataset to be test dataset.
- Scale-invariant feature detection and description
We should firstly project the image into a collection of vector features. The keypoints defined thoes who has local maxima and minima of the result of difference of Gaussians function in the vector feature space, and each keypoint will have a descriptor, including location, scale and direction. This process can be simply completed with the python lib CV2.
- Keypoints matching
To find the most similar image with geo-coordinates, we do keypoints match for each test image, finding the keypoint pairs with all images in the matching dataset. Then, calculating the sum distance of top 50 matched pairs' distance. We choose the image with the smallest sum distance as the most similar image and give its geo-coordinates to the test image.
- Error analysis
For each match-pair, we calulate the MSE(mean square error) of lantitude and longitude. In order to assess our result, We try to visualise the distribution of MSE and give a 95% CI of median value of MAE by bootstrapping.
Deep Learning
Web Implementation
Assessment
=Sift result assesment
Future Work
Links
Paintings/Photos geolocalisation GitHub
