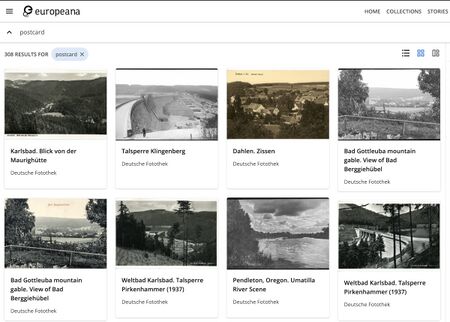
Europeana: mapping postcards
Introduction & Motivation
Introduction
The 'Europeana: Mapping Postcards' project is a unique fusion of historical culture and cutting-edge computer technology, aimed at creating an effective prediction pipeline. This pipeline is designed to forecast geographical mappings, or 'mapping', of Europeana's vast postcard collection, reminiscent of playing the GeoGuessr game, except here, it's the machine embarking on the geographical guessing adventure. We explored numerous methods and continually optimized the pipeline, ultimately deciding to primarily leverage OCR and LLM advanced technologies for the pipeline. This approach yielded impressive results.
Nevertheless, given the enormous volume of postcard records in Europeana, the large scale of local image processing, and the substantial economic costs of using commercial LLM models, we chose to work on a randomly selected but representative sample set, ensuring that the postcards are meaningful images with text on them. Our primary tasks in this project involved implementing OCR and LLM predictions on our dataset, evaluating the results, and developing a web platform for visualization. This endeavor transcends technological achievement; it's a voyage through time and space, catapulting history into the digital realm and inviting users to explore and connect with the past in a dynamic and interactive manner.
Motivation
Europeana, a digital platform and cultural heritage initiative, is funded by the European Union. While it houses an extensive collection of postcard records, the information provided is often incomplete, especially regarding the geographical details of the postcards, which may be biased. This is because the country contributing the postcard might not always be its actual place of origin. Therefore, enhancing the accuracy of the geographical details of these postcards is a a meaningful endeavor. Doing so can more vividly showcase these collections, offering a richer experience for today's audience in exploring European history and culture
Deliverables
- 39,587 records related to postcards with image copyrights from the Europeana website.
- 24,950 records, along with their metadata, provide direct access to 32,805 images.
- OCR results of a sample set of 350 images containing text.
- GPT-3.5 prediction results for a sample set of 350 images containing text, based on OCR results.
- A high-quality, manually annotated Ground Truth for a sample set of 309 images.
- GPT-3.5 prediction results for Ground Truth.
- GPT-4 prediction results for Ground Truth.
- An interactive webpage displaying the mapping of the postcards.
The GitHub repository contains all the codes for the whole project.
Methodologies
Data Collection
Using the APIs provided by Europeana, we used web scrapers to collect relevant data. Initially, we utilized the search API to obtain all records related to postcards with an open copyright status, resulting in 39,587 records. Subsequently, we filtered these records using the record API, retaining only those records whose metadata allowed for direct image retrieval via a web scraper, amounting to 24,950 records in total. We then organized this metadata, preserving only the attributes relevant to our research, such as the providing country, the providing institution, and potential coordinates.
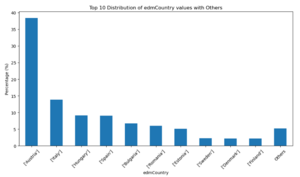
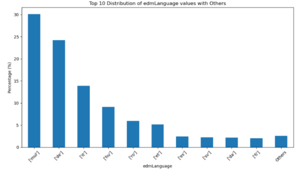
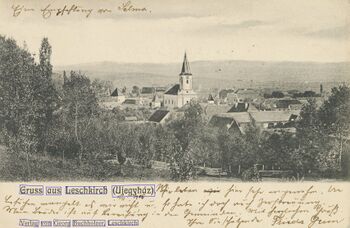
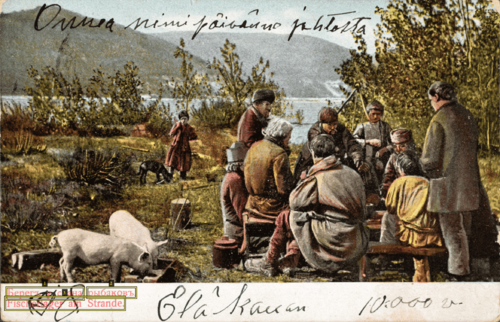
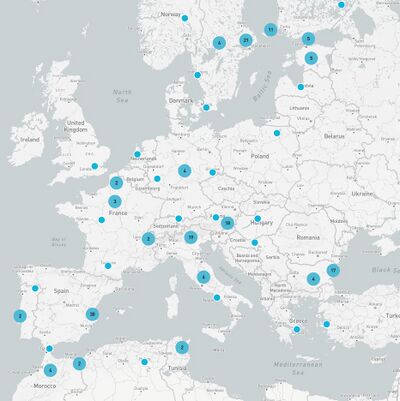
Subsequently, during our data collection process, we conducted a thorough analysis of all metadata. We found that the origins of these postcards were diverse, encompassing multiple countries such as Austria, Italy, Hungary, among others(Fig. 2). Furthermore, these postcards contained textual content in various languages, including German, Italian, Finnish, and more, encompassing a total of 21 languages (Fig. 3). The abbreviation "mul" in Fig. 3 denotes the presence of multiple languages, signifying that a single postcard might involve multilingual content. The diversity in languages and geographical origins posed a significant challenge for our geographical location inference.
Employing a method of random sampling with this metadata, we downloaded some image samples locally for analysis.
Optical Character Recognition(OCR)
This project aims to accurately extract textual information from various types of postcards in the European region and further utilize this information for geographic location recognition. To address the diversity of languages and scripts across the European region, the project adopts a multilingual model to ensure coverage of multiple languages, thereby enhancing the comprehensiveness and accuracy of recognition.
easy-OCR
EasyOCR is a ready-to-use OCR with 80+ supported languages and all popular writing scripts including: Latin, Chinese, Arabic, Devanagari, Cyrillic, etc. We initially tried this OCR model, but unfortunately, it requires pre-specifying a set language for text recognition in images. Specifying multiple languages simultaneously can lead to conflicts. For example, specifying languages that use the Cyrillic alphabet alongside those using the Latin alphabet results in conflicts, preventing simultaneous identification. Additionally, Europeana's postcard collection includes a variety of languages that use the Cyrillic alphabet, such as Bulgarian and Russian, and it's common to find postcards featuring multiple languages. If we were to specify a language for each postcard, the task would become very complex, especially considering that over one-third of the metadata language attributes are marked as 'mul', indicating that the language of the text on the postcards is uncertain.
PP-OCR
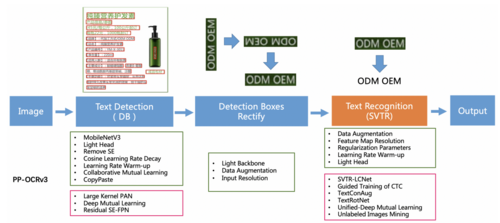
PP-OCR offers specialized models encompassing 80 minority languages, such as Italian and Bulgarian, which are particularly beneficial for this project. It is a practical ultra-lightweight OCR system, which consists of text detection, detection frame correction and text recognition, as shown in Figure 4. The purpose of text detection is to locate the text area in the image. In PP-OCR, it use Differentiable Binarization (DB) (Liao et al. 2020) as text detector which is based on a simple segmentation network. Detection Boxes Rectify is used to convert text boxes into horizontal rectangular boxes before proceeding with subsequent text recognition of the detected text. Since the detection boxes are comprised of four points, achieving this goal through geometric transformations is straightforward. However, the rectified box might end up being upside down. Therefore, a classifier is required to ascertain the text orientation. If it is determined that a box is upside down, it needs to be further rotated. For text recognizer, PP-OCR introduces lightweight text recognition network SVTR-LCNet, guided training of CTC by attention, data augmentation strategy TextConAug, better pre-trained model by self-supervised TextRotNet, U-DML, and UIM to achieve the balance of accuracy and efficiency.
In the project, postcards obtained from Europeana serve as the input for the original images, and segmentation is conducted using these original images.Based on the OCR results, since images without text are not helpful for subsequent work, we remove images that do not contain any textual information from the dataset. (Fig. 5)
Prediction Methods
Named Entity Recognition
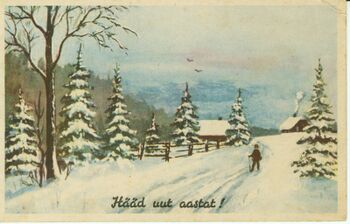
Initially, we explored utilizing Named Entity Recognition (NER) technology, such as spaCy, to identify geographical locations from Optical Character Recognition (OCR) results. However, it became evident that despite OCR effectively recognizing text content on postcards, it couldn't guarantee that the text invariably contains geographical location information(Fig. 6).In Figure 6, "Haad uut aastat!" is Estonian, meaning "Happy New Year!" In Estonia, this is a common phrase exchanged among people while celebrating the New Year, conveying mutual well wishes for the occasion. The successful recognition by OCR does not inherently imply the presence of geographical entities within the text, as the text on postcards may encompass various subjects beyond just geographical descriptions. This underscores the limitations of relying solely on OCR and NER for geographical location inference in postcards or similar documents.
ChatGPT
Due to the suboptimal performance of applying NER directly on OCR results, as OCR may contain grammatical errors in recognition or the text on the postcard itself may lack the names of locations, we decided to introduce an LLM, like ChatGPT, to attempt this task.
Using the OpenAI API, we primarily explored two methods based on different versions of GPT: one relying on a single modality of sequential data (text) and the other integrating visual and natural language information.
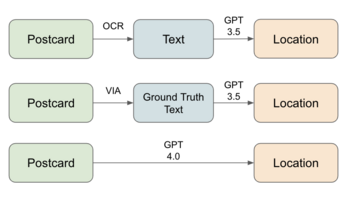
In the first approach, we leveraged Optical Character Recognition (OCR) technology to transform the original image into a textual sequence, which was then fed into the GPT-3.5 model. Through the GPT-3.5 model, we engaged in reasoning with textual information, aiming to infer geographical locations. This method accentuates the sequential nature of textual data and endeavors to predict geographical positions based on this foundation.
In contrast, the second approach involved directly inputting the raw image into the GPT-4 model, thereby harnessing the fusion of image and text data. GPT-4, functioning as a multimodal model, possesses the capability to process different modalities of information, enabling it to handle both image and text simultaneously. Our anticipation was for GPT-4 to extract essential visual information directly from the original image and combine it with textual content to output the corresponding geographical location.
Additionally, we required ChatGPT to return a fixed JSON format object, including the predicted country and city, eliminating the need for NER. We found that both methods significantly improved upon previous efforts. Although GPT-4 showed better performance, as it also had the image itself as additional information, we discovered that after multiple optimizations of the GPT-3.5 prompt, its results were not much inferior to GPT-4. Moreover, considering the cost, using OCR results with an optimized prompt for GPT-3.5 is an economical method. Therefore, we use this(Fig. 7) as our main pipeline.
Construction of Ground Truth
To scientifically evaluate the effectiveness of our prediction pipeline, it is necessary to create a ground truth for testing. To minimize the occurrence of postcard backs, we selected IDs that contain only one image for testing. Due to the highly uneven distribution of postcard providers on Europeana, we stipulated that no more than 30 IDs from the same provider were included in our random sampling. After sampling randomly from 35,000 IDs, we obtained 535 IDs from 24 different providers. Through the OCR process, we identified 350 IDs with recognizable text on the image, and after manual screening, we found 309 IDs to be meaningful postcards. We used GPT-3.5 to predict the OCR results of these 309 IDs and obtained a preliminary set of predictions, which we refer to as a noisy test set, as it is likely that there are still errors from the OCR model.
With the help of VGG Image Annotator (VIA), we decided to manually annotate this sample set of 309 IDs.During the annotation process, we only marked the text printed on the postcards, adopting a uniform standard and not annotating any handwritten script added later to the postcards. Additionally, we designated the origin (country and city) of each postcard, combining the postcard itself and its metadata. For postcards that mention a place name but cannot be located, we marked the country or city of origin as undefined. For other postcards whose origin could not be determined from the available information, we marked the country or city of origin as null.
After completing the Ground Truth, we then used our GPT-3.5 pipeline to predict using the manually annotated correct text results of the Ground Truth. Simultaneously, we used GPT-4 to perform predictive assessments on the Ground Truth as a comparison, to better evaluate the effectiveness of our prediction pipeline.
Web Application
Coordinate Retrieval
Ultimately, we acquired a collection of 293 postcards for visualization purposes, originating from 29 different countries and representing 78 distinct cities. After obtaining geographical location information, we utilized the OpenStreetMap API to retrieve coordinates. This step aimed to convert the extracted geographical data into precise coordinate representations, facilitating accurate positioning and display of relevant geographical information during the visualization process.
Web Development
This application is skillfully crafted using cutting-edge front-end technologies such as React and Next.js, alongside HTML and CSS, to deliver a seamless and responsive user experience. The use of Next.js not only enhances the application's performance and SEO capabilities but also synergizes with React to provide a robust platform for web development.
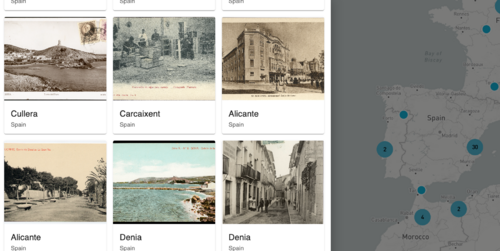
Central to the application's functionality is the integration of Mapbox, a powerful tool for interactive mapping. This integration allows for dynamic and responsive map interactions, such as zooming and panning, offering users an intuitive way to explore geographical data. Mapbox's advanced mapping capabilities enable the precise rendering of postcard locations on the map, enriching the user's exploration with detailed geographical contexts. Users can interact with the map to uncover postcards tied to specific locales, displayed in various formats ranging from single images to extensive collections.
The application's architecture, powered by Next.js, ensures fast loading times and optimal performance across a wide range of devices. This, coupled with Mapbox's fluid mapping interface, guarantees that users have a consistent and engaging experience, whether accessing the application on mobile devices or desktops. The zoom feature, a highlight of the Mapbox integration, allows for effortless navigation and discovery of postcards, making even the rarest or previously overlooked locations easily accessible.
In summary, this application represents a harmonious blend of modern web technologies and interactive mapping. It stands as a testament to how Next.js and Mapbox can be leveraged together to create a compelling, educational, and user-friendly platform. This platform not only showcases Europe's cultural and historical heritage but also brings it to life through an immersive and interactive digital experience.
Result Assessment
Based on Groud truth, we evaluated the accuracy of our three different pipelines(Fig. 12).
Initially, the Matching Accuracy of the entire location (comprising country and city) was computed. Evidently, employing GPT4 directly for postcard localization yielded the best performance. Conversely, the Matching Accuracy obtained using text extracted by OCR as input for GPT3.5 was lower compared to using Ground Truth text, indicating potential errors or incompleteness in the extracted text during the OCR phase.
Subsequently, due to the greater significance of country information in addresses (where accurate country details can provide a fundamental level of location accuracy even if city information is incomplete), a separate assessment was conducted solely for country information. A noticeable increase in Matching Accuracy was observed, confirming the relevance of postcard information for predicting country details. Notably, the Matching Accuracy of the pipeline using Ground Truth text as input for GPT3.5 aligned with that of GPT4. This highlights the significance of text quality, indicating that GPT3.5 may achieve a level of performance similar to GPT4 when accurate text is utilized. And at this stage, we preliminarily infer that some discrepancies in postcard matches could potentially arise from inherent misleading information contained within the postcards themselves.
| Method | Location(Country & City) | Country |
|---|---|---|
| OCR Text + GPT 3.5 | 62.8% | 72.7% |
| Groud Truth Text + GPT 3.5 | 71.3% | 89.1% |
| Postcard + GPT 4 | 76.1% | 89.1% |
Furthermore, we discovered that GPT-4 possesses the capability to recognize complex handwriting fonts. Simultaneously, it can identify historical entities that no longer exist, such as Austria-Hungary. This highlights the GPT-4 model's ability in handling handwritten text and concepts that span across different time periods and spaces, thereby offering broader possibilities for multi-domain information recognition and comprehension.
In summary, with the utilization of accurate text, GPT3.5 demonstrates the potential to achieve a performance level similar to GPT4. And the use of GPT4 in the pipeline demonstrated superior performance, further substantiating the advantage of integrating both image and text data for predicting the location details of postcards.
Limitations & Future Work
Limitations
OCR results
Our OCR results for the Cyrillic alphabet are not very good. Due to the need for OCR to process multiple languages simultaneously, particularly with frequent conflicts between Latin and Cyrillic alphabets, it is challenging to find an OCR model that can recognize multiple languages while ensuring a high accuracy rate. Additionally, the complexity is further compounded by the requirement to accurately recognize handwritten script, which often varies greatly in style and legibility.
Economic cost
For postcards without valid text, our framework can only utilize GPT-4 to make direct predictions on the images, which incurs a higher cost.
Future Work
Improve Text Recognition
Enhanced OCR capabilities are crucial for the project, as there is a pressing need to improve OCR technology for more effective handling of diverse scripts and languages. Furthermore, the integration of advanced AI models is pivotal. These sophisticated models are essential for accurately interpreting nuanced textual content on postcards, including challenges like handwritten notes or faded text, thereby significantly refining the quality and reliability of the texts extracted from postcards.
Explore alternative prediction methods
We primarily employed LLM models like ChatGPT for predicting the origins of postcards, but this approach incurs economic costs. Unfortunately, training a reliable LLM model is also challenging for individuals. Therefore, exploring other AI methods for accomplishing the prediction tasks could be a viable alternative.
Enhance user interaction and accessibility
Enhancing user interaction and accessibility within the "Europeana: Mapping Postcards" web application is crucial for its continued development and user engagement. By introducing more interactive features, the application can become more engaging and immersive.
Project plan & Milestones
Project plan
| Timeframe | Task | Completion |
|---|---|---|
| Week 4 |
|
✓ |
| Week 5 |
|
✓ |
| Week 6 |
|
✓ |
| Week 7 |
|
✓ |
| Week 8 |
|
✓ |
| Week 9 |
|
✓ |
| Week 10 |
|
✓ |
| Week 11 |
|
✓ |
| Week 12 |
|
✓ |
| Week 13 |
|
✓ |
| Week 14 |
|
✓ |
Milestones
- Completed the collection of Europeana postcard-related data and conducted initial analysis.
- Decided to initially focus on postcards with textual information, exploring the use of various OCR models to extract text from the postcards.
- Utilized NER (spaCy) to extract geographical information from OCR results, but found its effectiveness to be limited.
- Opted to use ChatGPT as a method for predicting postcard origins, combining OCR results with the GPT-3.5 model, and optimizing prompts, thus preliminarily establishing the entire prediction pipeline.
- Constructed Ground Truth using VIA and conducted an evaluation of the results.
- Developed a visualization platform for the interactive display of postcard mapping.
Github Repository
Acknowledgements
We express our gratitude to Professor Frédéric Kaplan, Sven Najem-Meyer, and Beatrice Vaienti from the DHLAB for their invaluable guidance throughout the duration of this project.
References
WebPages
Literature
- Li, Chenxia, Weiwei Liu, Ruoyu Guo, Xiaoting Yin, Kaitao Jiang, Yongkun Du, Yuning Du, et al. ‘PP-OCRv3: More Attempts for the Improvement of Ultra Lightweight OCR System’. arXiv, 14 June 2022. http://arxiv.org/abs/2206.03001.
- Liao, M.; Wan, Z.; Yao, C.; Chen, K.; and Bai, X. 2020. Real-Time Scene Text Detection with Differentiable Binarization. In AAAI, 11474–11481. 1, 5
