Paris: address book of the past
Introduction
This project works with around 4.4 million datapoints which have been extracted from address books in Paris (Bottin Data). The address books date from the period 1839-1922 and contain the name, profession and place of residence of Parisian citizens. In a first step, we align this data with geodata of Paris’s city network, in order to be able to conduct a geospatial analysis on the resulting data in a second step.
Motivation
In the 19th century, Paris was a place of great transformations. Like in many other European cities, the industrialization led to radical changes in people’s way of life, completely reordering the workings of both economy and society. At the same time, the city grew rapidly. While only half a million people lived there in 1800, the number of inhabitants increased by the factor of nearly 7 within one century. To get control over the expansion of the city and to improve people’s living conditions, the city underwent constructional changes during the Haussmann Period (1853-1870), leading to the grand boulevards and general cityscape that we know today.
While all those circumstances have been well documented and studied extensively, they could mainly be described in a qualitative manner, e. g. by looking at the development of certain streets. The Bottin dataset, providing information on persons, their professions and locations during exactly the time of change described above, will be able to open new perspectives on the research, as it permits to analyze the economic and social transformation on a grander scale. With this data, it will be possible to follow the development of a chosen profession over the whole city, or to look at the economic transformation of an Arrondissement throughout the century.
This project will give an idea of the potential which lies in the Bottin Data to contribute to the research on Paris’s development during the 19th century.
Deliverables
Github
The Github contains the code and data for all steps of the project. The following are the jupyter notebooks which were used for the alignment and analysis of the data. They should be executed in the order they are presented hereunder. For the sake of clarity and reusability, we collected the function of each notebook in seperate python files. The files used for a notebook will be given in brackets.
- Preprocessing.ipnyb (preprocessing.py): Preprocessing of the street names in the Bottin Data, including substitution of abbreviations.
- Street_processing.ipnyb (preprocessing.py, paris_methods.py): Aligning the two street network datasets "Open Data" (2022) and "Vasserot" (1836), solving conflicts for non-unique entries
- Alignment.ipnyb (preprocessing.py, alignment.py): Aligning bottin streets with the streets of the street data computed in street_processing.ipnyb
- Analysis.ipynb (analysis.py): Analysis on the aligned data
For an overview on the data files used and produced during the project, see the section "Data" in the Readme in Github.
Google Drive
The Google Drive contains all files which were too large to upload on Github. They should be put in the "data" folder on Github in order for the code to work without error.
Organisation
Milestones
Milestone 1
- Getting familiar with Geopandas, Shapely and the Bottin and both Street datasets.
- Developing a way to process Bottin data to be able to do perfect matching on a “dummy” street-dataset
Milestone 2
- Improve perfect matching by constructing dictionary of abbreviations and manually fix most common OCR-Mistakes.
- Find a way to deal with streets that matched on a short-streetname, which has multiple possible long-streetnames. For example Bottin data matched on “Voltaire” but we don’t know if “Rue Voltaire” or “Boulevard Voltaire”.
Milestone 3
- Combining the Opendata and Vasserot datasets into one dataset. Implementing a way to automatically merge streets with same name.
- Process the Bottin professions with Ravi’s code to get tags of professions.
Milestone 4
- Implement fuzzy-matching to align remaining Bottin data to streets.
Timetable
| Part | Street Data | Bottin Data | Analysis | |
|---|---|---|---|---|
| Week 4 | Alignment | First look at Datasets, learn geopandas | Preprocessing | - |
| Week 5 | Street visualisation | Perfect Matching with first Street Data | ||
| Week 6 | Develop & implement strategy to work with duplicates | |||
| Week 7 | Substituting abbreviations, | |||
| Week 8 | ||||
| Week 9 | Have one single street dataset | |||
| Week 10 | Updating Street Data | |||
| Week 11 | Update methods for 1836 dataset
(before 1791 dataset) |
Fuzzy Matching,
Updating Street Data, Including profession tags | ||
| Week 12 | Analysis | General Analysis | ||
| Week 13 | Assign streets to geographical regions | - | Specific Points | |
| Week 14 |
Alignment
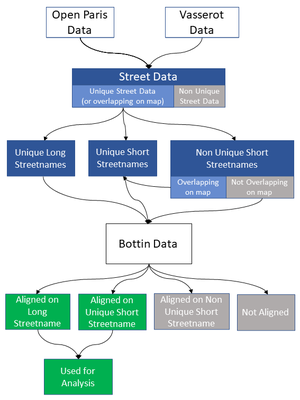
The alignment happened in two steps: First, two street network datasets of the years 1836 and 2022 were combined to create one dataset which incorporates all available geodata. Second, this dataset was used to align the Bottin datapoints with a matching street and thus georeferenced.
Aligning Street Datasets
The Street Datasets
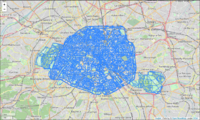
Two geolocated street datasets were used in this project. The Vasserot dataset [1] 1836 provides a baseline how the city looked like in the beginning of the dataset. The Opendata dataset [2] gives an accurate depiction of the street network of today. Both datasets were combined into one dataset in order to be able to geolocate the Bottin datapoints.
Preprocessing
In order to be able to compare the streetnames of both datasets, all streetnames were converted into lowercase and accents were substituted by their counterpart without accent. The signs "-_" as well as double spaces were turned into one space. The Vasserot dataset contained empty streetnames which were removed from the dataset.
Vasserot duplicate streets
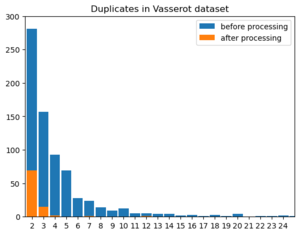
In the Vasserot dataset streets are often named more than once. This is because the authors of the dataset treated segments of the same street as a unique entity and because in Paris some streetnames were not unique during that time. For our analysis we needed to differentiate between those two cases and combine the geolocated data of all street segments.
To combine street segments we used the shapely package to see if streets with the same name are overlapping or are closer than a given distance. In the end we decided on a distance of 200meters, after checking the results manually.
With this approach we could reduce the number of duplicate streetnames from 729 to 88. We excluded those duplicate streets from further analysis and focused on the 1202 unique streetnames.
Comparing Opendata and Vasserot streets
To be able to assign each streetname to one geolocation we had to merge the Opendata and the processed Vasserot dataset. For this we used the same approach as above and compared if streets that share the same name are closer than 200 meters from another. 50 Streets that appeared in the "Opendata" and the Vasserot dataset and were further than 200 meters apart were excluded from further analysis.
In an additional step, we grouped the streets on their short streetnames (without their street type), because this information was needed during the alignment. Also here, streets with the same short streetname but different full streetname which were closer to each other than 200 meters were merged into a "unique short streetnames" dataset, whereas the rest was saved under the name "non unique short streetnames".
Our final dataset includes 7204 unique streetnames. During the processing of the streets we excluded 138 streetnames from our dataset.
Aligning Bottin Data with Street Data
After having constructed one dataset of past and present streets in Paris, it will be used to align each datapoint of the Bottin Data with a geolocation. The alignment process is decribed in detail in the following chapter. For this, we first introduce the Bottin dataset, then elaborate on the methods of the alignment process and finally estimate the quality of the alignment.
Bottin Dataset
The dataset referred to as “Bottin Data” consists of slightly over 4.4 million datapoints which have been extracted via Optical Character Recognition (OCR) out of address books named “Didot-Bottin” from Paris. The address books are from 55 different years within the time span of 1839 and 1922, with at least 37’177 entries (1839) up to 130’958 entries (1922) per given year. The address books can be examined at the Gallica portal[3]. Each entry consists of a person’s name, their profession or activity, their address and the year of the address book it was published in.
As the extraction process from the scanned books was done automatically by OCR, the data is not without errors. Di Lenardo et al.[4], who were responsible for the extraction process, estimated that the character error amounts to 2.6% with a standard deviation of 0.1%, while the error per line is 21% with a standard deviation of 2.9%.
Tagged Professions
This project was able to build upon previous work by Ravinithesh Annapureddy[5], who wrote a pipeline to clean and tag the profession of each entry in the data. As the code was not necessarily written for the exact dataset we worked with, the notebook “cleaning_special_characters.ipynb” could not be used, as it referenced the entries by row number in the dataframe. However, the notebooks “creating_french_dictionary_words_set.ipynb” and “cleaning_and_creating_tags.ipynb” were successfully run, adding to each entry in the Bottin Data a list of tags. Those tags were the result of a series of steps including the removal of stopwords (such as “le” or “d’”), the combination of broken words, spell correction (using frequently appearing words in the profession data and two external dictionaries) and the extension of abbreviations.
We faced two challenges using the pipeline by Ravinithesh. First, the pipeline was not optimized for large datasets, so it took a long time to run. Second, the created tags were stored in a list and there has not been any work done to cluster them to profession sectors or fields, which made the usage difficult during the analysis. We chose to convert the lists (e.g. [‘peints’, ‘papier’]) to a string where the tags were comma-separated (“peints, papier”). Effectively, this meant that we corrected misspelled professions, which for example led to almost 1000 more entries having the profession entry “vins”. But at the same time, it did not take an entry like “peints, papier” into account when selecting the profession “peints” in the analysis.
Alignment Process
The alignment was conducted on the street level. For this, the street column (“rue”) of the Bottin dataset was used to carry out a left join, using three different versions of the street network data as the dataset “on the right side”:
(1) The column with the full (long) street name of the street data,
(2) the column with the short street name (meaning without type of the street) of the street data, where the short street names are unique, and
(3) the street data with non-unique short street names.
The reason for joining both on the full and short street names lies in the fact that the entries in the Bottin dataset often only contain short versions of the street names and thus cannot be matched on the full street names. Moreover, the division into unique and non-unique short street names was made with regards to the analysis which followed afterwards. As the non-unique data is by nature ambiguous, it is not used in the analysis. However, as the streets still appear in the Bottin data, they have to be matched. Otherwise, we would have risked letting them match to wrong streets during the fuzzy matching step.
After each alignment, the newly aligned data was appended to already aligned data and the next alignment was repeated with all entries which had not been successfully aligned yet. Several matching methods were conducted consecutively, namely perfect matching, matching without spaces and fuzzy matching. Within each method, the alignment was first executed for the long street names (1), then for the unique short street names (2) and in the end for non-unique short street names (3).
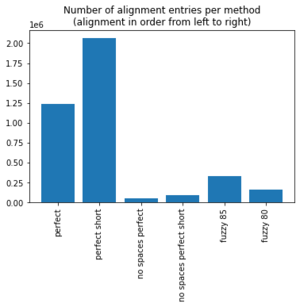
The overall achieved alignment is 89.30%, with 84% of the aligned data matched with perfect matching, 4% without spaces and 12% with fuzzy matching.
Preprocessing
Before the alignment could be conducted, the same preprocessing function used for the street networks was run, meaning that characters with accents were substituted by their counterpart without accent and the signs "-_" as well as double spaces were turned into one space. Additionally, as the dataset contained around 1.5 million abbreviations, we wrote two dictionaries with which we could substitute those abbreviations:
- The first dictionary was built using the Opendata Paris street network, as it lists streets in three versions: their long streetname (e.g. “Allée d'Andrézieux”), the abbreviated streetname (prefix abbreviated, e.g. “All. d'Andrézieux”), short streetname (e.g. “ANDREZIEUX”). We computed the difference between long and short street names (“Allée d’”) and the difference between abbreviated and short street names (“All. d‘”) and saved the resulting pair in the dictionary. This way, around 500’000 abbreviations could be substituted.
- The second dictionary was built manually, by printing the most common abbreviations left in data and saving them with their corresponding correct form in the dictionary. With only 152 dictionary entries, the number of abbreviations could be further lowered from around 1 million to less than 50’000.
Perfect Matching
The first method for the alignment consisted in perfect matching. Therefore, the preprocessed street (“rue_processed”) from Bottin Dataset was joined (left join) with the preprocessed street columns of the street dataset (on (1), (2) and (3) respectively, see Alignment Process).
With this method, already 75% of the whole dataset could be aligned.
More specifically, 28.08% were perfectly aligned on the long street names (1), 35.86% on the unique short street names (2) and 10.93% on the non-unique short street names (3).
Perfect Matching without Spaces
As the OCR often did not recognize spaces correctly, we decided to align the streets after having deleted all whitespaces. Additionally, we deleted the characters | . : \ and saved the resulting strings in new columns respectively. On those columns, perfect matching like above was carried out. Although the relative number seems small – only 1.44% of the Bottin data was aligned on (1), 1.71% on (2) and 0.31% on (3) with this method – this still amounts to around 145’000 datapoints in the Bottin dataset.
Fuzzy Matching
Until this point of the process, the alignment was based on perfect matching, including some manual changes of the data. In order to be able to account for the OCR mistakes which are present in the Bottin data, fuzzy matching was included, allowing for very similar strings to align.
The process of finding the most similar street out of a list of possible streets was implemented with the help of the library fuzzywuzzy[6], which computes a similarity ratio[7] based on the Levenshtein distance and the length of the strings. The basic idea of the Levenshtein distance is to count how many substitutions, deletions or insertions are needed to transform one string into another. The fuzzywuzzy library allows for a score cutoff value: If the similarity between two words falls below the given cutoff value, the algorithm returns None. This speeds up the computation significantly.
For the alignment, the thresholds 80% and 85% for the similarity ratio were chosen, based on manual assessment of the alignment quality. Afterwards, for each threshold, a dictionary was computed, pairing a street from the Bottin data which was not yet aligned with its most similar street from the street dataset (provided it met the threshold). For computation efficiency reasons, only the 10’000 most common streets of the Bottin dataset were considered, amounting to 386’678 of all the data. For the alignment, a new column in the Bottin dataset was created, mapping each street entry to its counterpart in the dictionary (if it existed). Afterwards, this column was aligned with the long street data from the street dataset. Here, the short street names were neglected, as previous short analysis showed that the quality of the alignment was too low.
In the end, 7.43% of the Bottin data could be aligned with fuzzy matching and threshold 85. Afterwards, the threshold 80 was applied, which means that only streets with threshold between 80 and 85 were matched, as the rest was already aligned before. This yielded an additional 3.71% of alignment.
Quality Assessment of Alignment
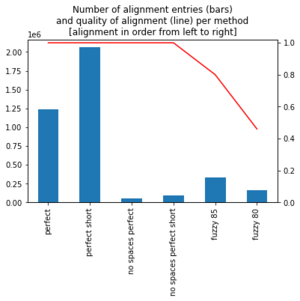
In order to assess the quality of the alignment, for each method (perfect, without spaces, fuzzy 85 and fuzzy 80), we randomly sampled 100 aligned entries and checked if the match was correct.
For the perfect matching as well as for the matching without spaces, we found that 100% of the matches were correct. This is not surprising, as those methods basically only allow for an alignment if the strings are the same. Hence, we can state with almost certainty that 88% of the aligned data is correct.
The numbers were also good for fuzzy matching using the threshold of 85: Still 82% of the sampled data was matched correctly and 5% had matching short street names, but the street type was not the same (e.g. “avenue Chateaubriand” matched to “Rue Chateaubriand”). The reason was that the street type from the Bottin data did not exist in the street network dataset. For the 13% of wrongly aligned datapoints, the whole street name often could not be found in street network dataset and thus the fuzzywuzzy algorithm matched it another street entirely (e.g. “boul. de la Gare” matched to “Boulevard de la Guyane”).
Those tendencies intensified for the fuzzy matching with threshold of 80, which led to a correct alignment of only 49%. However, one has to take into account that the alignment was only done on the data which had not been matched before with threshold 85. Moreover, 21% of the sampled datapoints were not correctly matched as a whole, but matched on the short street name, while the street type in the Bottin data did not appear in street network dataset. As we could see during the street processing, more than 60% of the streets which had the same name but not the same street type lay very close to each other (buffer of 100m), so there is a high chance that at least half of the streets matched on the name and not the type has a geolocation close to the ground truth. This would raise the correct alignment to around 60%. Finally, 30% of the sample were wrongly classified. This was mainly due to missing street names in the street network dataset and still existing abbreviations in the Bottin data, which complicated matching (e.g. “Fbg-Poissonnière” matched to “Rue Poissonnière”).
All in all, we can calculate the following error rate:
Probability(error) = 0.88 * 0 + 0.08 * 0.18 + 0.04 * 0.51 = 0.0348
This means that with a conservative estimation of the error, we can state that the data is correctly aligned with a probability of more than 96%.
Analysis
The aligned Bottin dataset gives room to a great number of possible analysis which could be conducted on the data. In this section, we show some ideas we explored.
Development of Professions
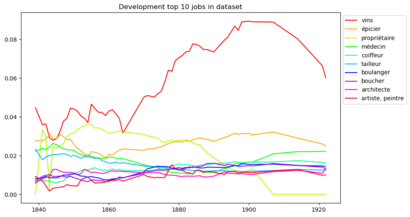
On the left graph, one can see the development of the top 10 most frequent jobs in the Bottin dataset. The y-axis displays the ratio of the frequency of the job divided by all entries in a given year. It is very interesting to observe the increase of people in wine making business. As di Lenardo et al.[8] mentioned in their paper, the increase in wine making during the 19th century goes along with a significant growth of wine consumption and can thus be seen in other statistics as well. The decline around 1910 might be due to the fact that there was a overproduction crisis in the beginning of the 20th century[9]. While the ratio for professions connected to the daily life like grocer (épicier) or boulanger (baker) stayed more or less constant, the steep decline of the ratio of property owners stands out. A possible explanation could be that the while the share of property owners is declining drastically, the absolute change is not as big. However, this only accounts for part of the change and it might be interesting to look into it further.
Professions being born and dying out
Another idea was to look at the dataset to see which professions were born during the period we can observe and which ones died out. The year of 1880 was chosen as the dividing year and only professions which appeared in the dataset more than 50 times were selected. Based on this, the following professions "were born" after 1880:
['cannage', 'électriciens', 'garage', 'jerseys', 'postiches', 'massage', 'pneumatiques', 'décolleteur', 'bicyclettes', charbonnière', 'importateurs', 'outillage', 'brocanteuse', 'reconnaissances', 'ravalements', 'stoppeuse', 'triperie', 'automobiles', 'bar', 'masseur', 'décolletage', 'patrons', 'phototypie', 'masseuse', 'cycles', 'alimentation']
Similarly, the following professions only existed in the dataset before 1880:
['toiseur', 'grènetier', 'prop', 'pair', 'lettres', 'pension', 'huile', 'mérinos', 'accordeur', 'garni', 'bonnets']
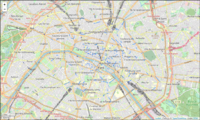
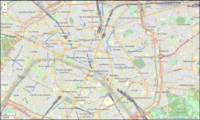
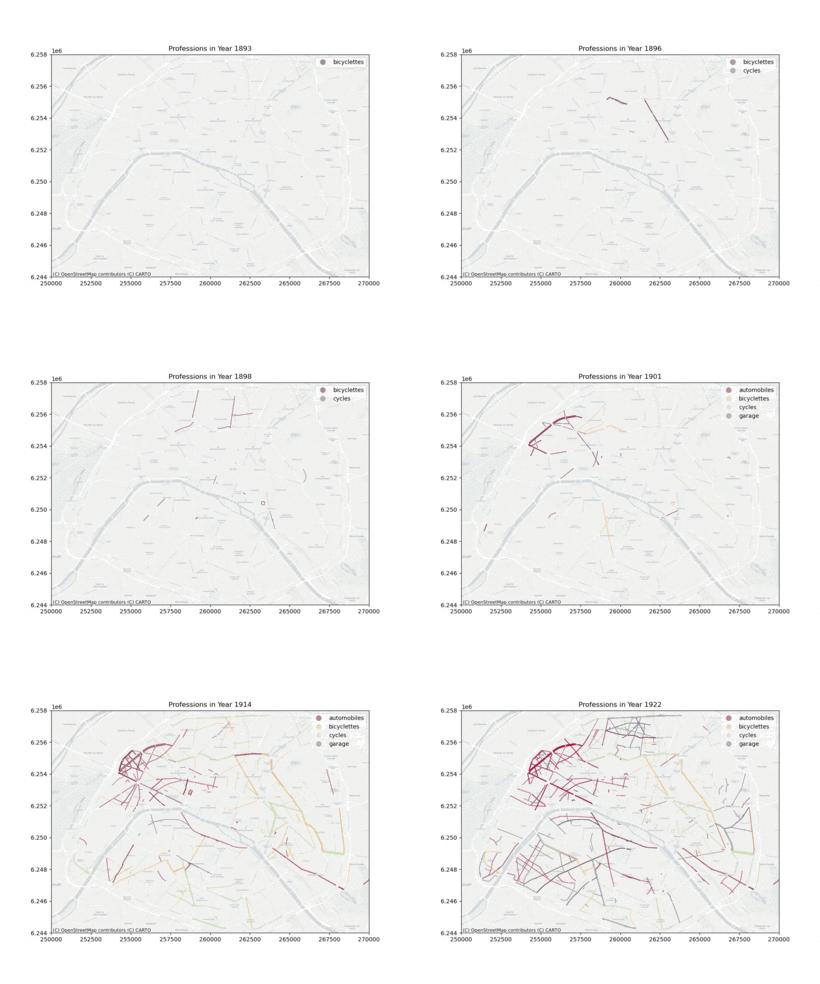
Most of the professions which died out probably have done so in our data, but not in the Parisian society. For example, there are still shops which sell bonnets today in Paris, and tuners (accordeur) are needed until today. On the other hand, the professions appearing after 1880 show some patterns. Professions which did not exist before, because they are based on inventions made during this time, include those to do with electricity, bicycles or cars. To retrace the development of the new "mobility branch" in Paris, the following gif was created:
One can see that the development started with bicycles, but soon includes automobiles and then spreads rather quickly throughout the city. In the end, the graphic shows a relatively even distribution over Paris, with a slight concentration in the northwest.
Development of Streets
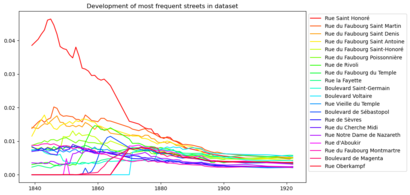
On the right, we see the plot of the 20 most frequent streets in the Bottin data, their absolute frequency being divided by the total number of streets in the dataset of the respective year. In this plot, it is clearly visible that the street network grew extremely during the 19th century, as the share of the most frequent streets compared to all datapoints visibly decreases.
Case Study: Comparing two Streets
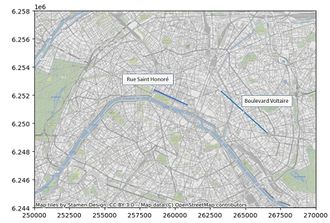
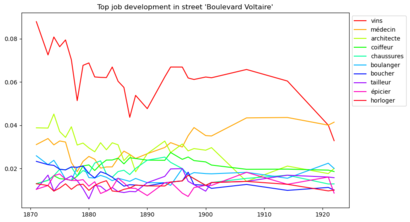
The idea of the Case Study was to examine if we could see a difference between streets which have already existed for some time and those which were newly constructed during the Haussmann period. For this, we chose the Rue Saint Honoré, one of the oldest streets in the city, and the Boulevard Voltaire, which was built during the Haussmann period.
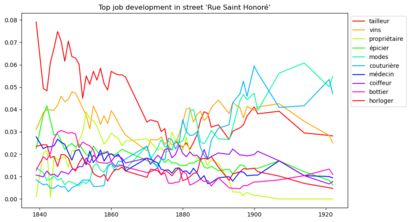
Comparing the top 10 frequent professions in both streets, we can see that the Rue Saint Honoré has a much more diverse and specific selection of frequent jobs (related to fashion), however it also experienced a change during the 1870s. Maybe due to the already existing tailors in the street, the businesses of fashion and dressmaking (couturière) seem to florish. On the other side, the Boulevard Voltaire is mostly populated by professions needed in daily life, like shoemakers, bakers or hairdressers. However, we also see a high number of doctors and architects, indicating that the street was not a poor one.
Making overall change visible
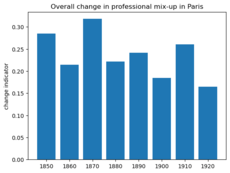
We worked on a way to visualize the overall change in the professional mix-up of the city. We constructed a dataset containing all jobs and time periods. We stored the percentage of how often that job was recorded in the given time period. This allowed us to compare the change between two time periods. We summed up the absolute (percentual) change between two time periods to give us an indicator for overall change in the professional mix-up.
Its visible that there is constant change in the professional mix-up of the city. The indicated values are certainly too high, because our method is not resistant to different notations of the same profession and OCR-mistakes, nevertheless they give us an indication when the big professional changes in the city occurred. For Paris as a whole the highest peak change between the decades is in the 1870ies.
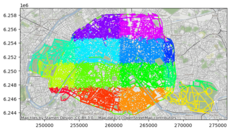
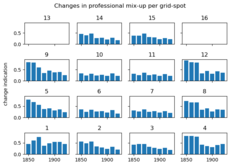
We wanted to look at if this development is the same for all regions. For this we cut the city in 16 equally spaced rectangles and calculated the same indicator for this regions. With this we see a symmetry between the North and South(grid-spots: 2,3,10,11), and East and West(grid-spots: 5,9, 8,12). As expected the regions in the center did not experience as much change as the regions further from the center.
Limitations of the Project
During the implementation of our project, we faced some challenges which we will discuss in this section.
OCR Mistakes
- The OCR mistakes which were made during the extraction of the data, together with the many abbreviations especially for the street types in the Bottin data, led to difficulties during the fuzzy matching. Here, although already very helpful, the Levenshtein distance might not be the most optimal solution to conduct string similarity. Another idea would be to use a customized distance function which punishes character substitutions/insertions at the end of the string more than at the beginning of the string.
Missing streets
- One challenge which influenced the alignment even greater than the OCR mistakes lay in the lack of corresponding streets in the street data. Many of the not aligned and wrongly aligned streets came from the fact that they were (almost) spelled correctly, but did not have a counterpart to align on (e.g. the "rue d'Allemagne").
- Another reason for the missing streets could be that the given data in the Bottin dataset was not always necessarily a street, but might have sometimes described a place which was commonly known and thus excepted in the address book (e.g. "cloître" - monastery). A solution for this could be to lay emphasis on the street name rather than the street type.
Ambiguous streetnames
A great challenge during the alignment was the question how to work with inherently ambiguous data.
- In the 1836 street network dataset, there existed datapoints which had the same streetname, but were not located near each other. For this project, we decided to neglect them in the further pipeline, but with more time, it might be reasonable to correct them manually.
- Many bottin datapoints aligned on the short street name, meaning that the street type was not mentioned in the Bottin data.
Short streetnames were often abmiguous, meaning that they referred to several different streets. We wondered if the reference might have been clear at the point in time when the address book was published, so we thought of incorporating when which street was built. However, due to time constraints, we could not follow this path.
Matching on street level
- Although we managed to get good result during the alignment, we only conducted the pipeline on the street level. Especially for long streets, this is imprecise. So in order to properly geolocate each datapoint, one would need an additional step to clean and align address numbers.
Small part of potential analysis
Last but not least, the dataset has a lot of potential for analysis, but we only managed to get a brief analysis done. This was mainly due to two constraints:
- The time constraint: The time of the semester project is limited and as we already needed many of our resources for the alignment process, the analysis could not be conducted thoroughly.
- The knowledge constraint: In order to put findings of the analysis into context and recognize noteworthy aspects, it would have been beneficial to get more (historical) knowledge about Paris, either through own acquisition or third parties. But unfortunately, time was the limiting factor here, too.
Outlook
Perfection of Alignment
- include address numbers
- get more street data, maybe other dataset from 19th century
- two-step alignment of short streetname and then type of street: if the short street name of street dataset is contained in a given bottin entry, then do perfect matching and try to find corresponding street type afterwards
- alternatively/in combination: write custom ratio which punishes substitutions, deletions or insertions in last part of string more, as probability of mistake/non-alignment in first part of string higher (see experience of fuzzy matching, often abbreviations at beginning cause problems)
- align on the whole datapoint (name, profession, street) to account for businesses existing more than one year. This could help with continuity in the dataset and would especially help when cleaning names
- include the duplicate streets that were excluded in this analysis. For example by using a dataset with the years each street was built/destroyed.
Possible Directions of Research
- Work on Professions: Cluster in thematic fields, maybe classify by social reputation (-> gentrification of a quartier?)
- Analysis: gentrification, development of arrondissements, influence of political decisions on social/economic landscape,...
- Visualization: interactive map
References
- ↑ https://alpage.huma-num.fr/donnees-vasserot-version-1-2010-a-l-bethe/
- ↑ https://opendata.paris.fr/explore/dataset/voie/information/ (last update 2018)
- ↑ Gallica portal, Bibliothèque Nationale de France, https://gallica.bnf.fr/accueil/en/content/accueil-en?mode=desktop; example for an address book on https://gallica.bnf.fr/ark:/12148/bpt6k6314697t.r=paris%20paris?rk=21459;2
- ↑ di Lenardo, Isabella; Barman, Raphaël; Descombes, Albane; Kaplan, Frédéric, 2019, "Repopulating Paris: massive extraction of 4 Million addresses from city directories between 1839 and 1922.", https://doi.org/10.34894/MNF5VQ, DataverseNL, V2
- ↑ Annapureddy, Ravinithesh (2022), Enriching-RICH-Data [Source Code]. https://github.com/ravinitheshreddy/Enriching-RICH-Data
- ↑ Cohen, Adam. Fuzzywuzzy, 13. Feb. 2020, https://pypi.org/project/fuzzywuzzy/
- ↑ similarity ratio based on library python Levenshtein, see https://maxbachmann.github.io/Levenshtein/levenshtein.html#ratio
- ↑ di Lenardo et al, 2019, see reference above
- ↑ Saucier, Dominic, "La crise viticole de 1907 – Site de Sommières et Son Histoire", 03.08.2019, https://www.sommieresetsonhistoire.org/la-crise-viticole-de-1907-site-de-sommieres-et-son-histoire/
