Europeana: mapping postcards: Difference between revisions
| Line 68: | Line 68: | ||
! Method !! Location(Country & City) !! Country | ! Method !! Location(Country & City) !! Country | ||
|- | |- | ||
| Text + GPT 3.5 || 62.8% || 72.7% | | OCR Text + GPT 3.5 || 62.8% || 72.7% | ||
|- | |- | ||
| Groud Truth Text + GPT 3.5 || 71.3% || '''89.1%''' | | Groud Truth Text + GPT 3.5 || 71.3% || '''89.1%''' | ||
Revision as of 22:56, 19 December 2023
Introduction & Motivation
Introduction
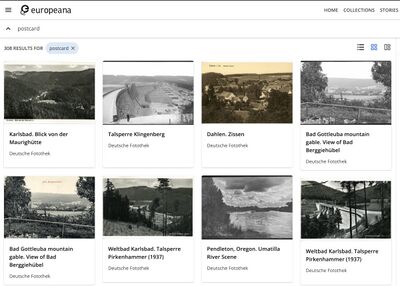
Europeana is a digital platform and cultural heritage initiative funded by the European Union. The "Europeana: Mapping Postcards" project represents a unique fusion of history and advanced technology, leveraging Europe's extensive collection of cultural postcards to achieve geographical mapping of these items. Envisioning the transformation of these postcards into a dynamic digital archive, the initiative aims to bring to life the stories and origins of these historical treasures, offering a window into Europe's rich cultural and historical diversity. This project not only preserves these valuable artifacts but also makes them accessible and interactive, allowing for a deeper exploration and understanding of Europe's past.
Motivation
Although Europeana stores many records about postcards, this information is not always complete, particularly regarding the geographical details on the postcards, which may be biased. This is because the country providing the postcard is not necessarily the place of origin of the postcard. Therefore, refining the geographical details of these postcards is a meaningful endeavor, as it can more vividly showcase these collections, offering a more enchanting experience of exploring European history and culture for today's audience.
Deliverables
- 39,587 records related to postcards with image copyrights, along with their metadata, from the Europeana website.
- OCR results of a sample set of 350 images containing text.
- GPT-3.5 prediction results for a sample set of 350 images containing text, based on OCR results.
- A high-quality, manually annotated Ground Truth for a sample set of 309 images.
- GPT-3.5 prediction results for Ground Truth.
- GPT-4 prediction results for Ground Truth.
- An interactive webpage displaying the mapping of the postcards.
- The GitHub repository contains all the codes for the whole project.
Methodologies
Data collection
Using the APIs provided by Europeana, we used web scrapers to collect relevant data. Initially, we utilized the search API to obtain all records related to postcards with an open copyright status, resulting in 39,587 records. Subsequently, we filtered these records using the record API, retaining only those records whose metadata allowed for direct image retrieval via a web scraper, amounting to 20,000 records in total. We then organized this metadata, preserving only the attributes relevant to our research, such as the providing country, the providing institution, and potential coordinates. Employing a method of random sampling with this metadata, we downloaded some image samples locally for analysis.
Optical character recognition(OCR)
This project aims to accurately extract textual information from various types of postcards in the European region and further utilize this information for geographic location recognition. To address the diversity of languages and scripts across the European region, the project adopts a multilingual model to ensure coverage of multiple languages, thereby enhancing the comprehensiveness and accuracy of recognition.
PP-OCR
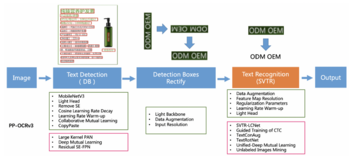
PP-OCR offers specialized models encompassing 80 minority languages, such as Italian and Bulgarian, which are particularly beneficial for this project. It is a practical ultra-lightweight OCR system, which consists of text detection, detection frame correction and text recognition, as shown in Figure 2.
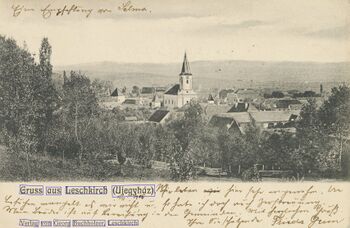
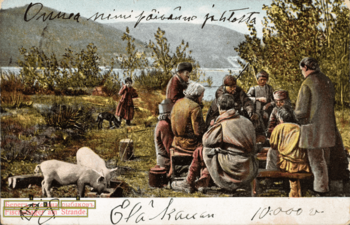
In the project, postcards obtained from Europeana serve as the input for the original images, and segmentation is conducted using these original images. (Fig. 3)
Based on the OCR results, since images without text are not helpful for subsequent work, we remove images that do not contain any textual information from the dataset.
Prediction using ChatGPT
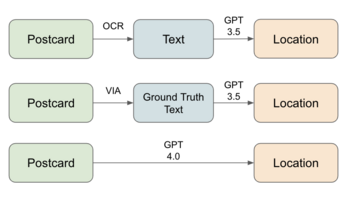
Due to the suboptimal performance of applying NER directly on OCR results, as OCR may contain grammatical errors in recognition or the text on the postcard itself may lack the names of locations, we decided to introduce an LLM, like ChatGPT, to attempt this task. Using OpenAI APIs, we mainly explored two approaches: one was to use GPT-3.5 for location prediction based on OCR results, and the other was to directly use GPT-4 for predictions based on images. Additionally, we required ChatGPT to return a fixed JSON format object, including the predicted country and city, eliminating the need for NER. We found that both methods significantly improved upon previous efforts. Although GPT-4 showed better performance, as it also had the image itself as additional information, we discovered that after multiple optimizations of the GPT-3.5 prompt, its results were not much inferior to GPT-4. Moreover, considering the cost, using OCR results with an optimized prompt for GPT-3.5 is an economical method. Therefore, we use this as our main pipeline.
Construction of Ground Truth
To scientifically evaluate the effectiveness of our prediction pipeline, it is necessary to create a ground truth for testing. To minimize the occurrence of postcard backs, we selected IDs that contain only one image for testing. Due to the highly uneven distribution of postcard providers on Europeana, we stipulated that no more than 30 IDs from the same provider were included in our random sampling. After sampling randomly from 35,000 IDs, we obtained 535 IDs from 24 different providers. Through the OCR process, we identified 350 IDs with recognizable text on the image, and after manual screening, we found 309 IDs to be meaningful postcards. We used GPT-3.5 to predict the OCR results of these 309 IDs and obtained a preliminary set of predictions, which we refer to as a noisy test set, as it is likely that there are still errors from the OCR model.
With the help of VGG Image Annotator (VIA), we decided to manually annotate this sample set of 309 IDs.During the annotation process, we only marked the text printed on the postcards, adopting a uniform standard and not annotating any handwritten script added later to the postcards. Additionally, we designated the origin (country and city) of each postcard, combining the postcard itself and its metadata. For postcards that mention a place name but cannot be located, we marked the country or city of origin as undefined. For other postcards whose origin could not be determined from the available information, we marked the country or city of origin as null.
After completing the Ground Truth, we then used our GPT-3.5 pipeline to predict using the manually annotated correct text results of the Ground Truth. Simultaneously, we used GPT-4 to perform predictive assessments on the Ground Truth as a comparison, to better evaluate the effectiveness of our prediction pipeline.
Enhanced Web Application Features
The application harnesses front-end technologies like React, HTML, and CSS for a responsive experience, integrating Mapbox for interactive mapping. This setup provides a detailed geographical context for exploring the postcards. It features advanced aggregation from the Test Images set, ensuring clear and effective display on the map. The dynamic approach adapts to user interactions, such as zooming, to maintain clarity and intuitive navigation. Interactive map pins reveal a drawer component when clicked. This feature elegantly displays the postcards associated with each pin, varying from single images to lists based on location, allowing users to delve into the historical context. The zoom functionality is designed to enhance engagement, offering detailed views at closer levels and a broader perspective at higher levels. This ensures an engaging and accessible experience throughout. The drawer component provides a user-friendly interface for in-depth exploration of postcards. It enables smooth and intuitive browsing, enriching the overall experience.
By combining these features with a user-centric design, the Europeana Postcards web application stands as a unique platform for exploring Europe's cultural and historical heritage, marrying historical content with modern technology to create an educational and engaging user experience.
Result Assessment
Based on Groud truth, we evaluated the accuracy of our three different pipelines(Fig. 4).
Initially, the Matching Accuracy of the entire location (comprising country and city) was computed. Evidently, employing GPT4 directly for postcard localization yielded the best performance. Conversely, the Matching Accuracy obtained using text extracted by OCR as input for GPT3.5 was lower compared to using Ground Truth text, indicating potential errors or incompleteness in the extracted text during the OCR phase.
Subsequently, due to the greater significance of country information in addresses (where accurate country details can provide a fundamental level of location accuracy even if city information is incomplete), a separate assessment was conducted solely for country information. A noticeable increase in Matching Accuracy was observed, confirming the relevance of postcard information for predicting country details. Notably, the Matching Accuracy of the pipeline using Ground Truth text as input for GPT3.5 aligned with that of GPT4. This highlights the significance of text quality, indicating that GPT3.5 may achieve a level of performance similar to GPT4 when accurate text is utilized. And at this stage, we preliminarily infer that some discrepancies in postcard matches could potentially arise from inherent misleading information contained within the postcards themselves.
| Method | Location(Country & City) | Country |
|---|---|---|
| OCR Text + GPT 3.5 | 62.8% | 72.7% |
| Groud Truth Text + GPT 3.5 | 71.3% | 89.1% |
| Image + GPT 4 | 76.1% | 89.1% |
In summary, the use of GPT4 in the pipeline demonstrated superior performance, further substantiating the advantage of integrating both image and text data for predicting the location details of postcards.
Limitations & Future Work
Improve Text Recognition
Enhanced OCR capabilities are crucial for the "Europeana: Mapping Postcards" project, as there is a pressing need to improve OCR technology for more effective handling of diverse scripts and languages, especially beneficial for postcards featuring non-standard fonts or multiple languages. Furthermore, the integration of advanced AI models is pivotal. These sophisticated models are essential for accurately interpreting nuanced textual content on postcards, including challenges like handwritten notes or faded text, thereby significantly refining the quality and reliability of the data extracted from these historical treasures.
Enhance Geographic Accuracy
To achieve enhanced geographic accuracy in the "Europeana: Mapping Postcards" project, developing specialized AI algorithms is key. These algorithms, tailored to interpret and correct geographical data, are particularly vital for postcards with ambiguous or historically altered place names. Additionally, collaboration with historical experts is essential. Partnering with historians and geographical experts can significantly improve the accuracy of location data, an important aspect for postcards depicting locations that have undergone changes over time. This dual approach combines technological innovation with expert knowledge to ensure the historical integrity and geographical precision of the postcard collection.
Integration with Other Historical Resources
Cross-referencing the "Europeana: Mapping Postcards" collection with other historical databases is a strategic move to deepen contextual understanding. This integration, encompassing historical maps, texts, and photographic archives, promises a richer, multi-faceted view of history. Furthermore, collaborating with cultural institutions like museums, archives, and galleries opens avenues for joint projects, positioning postcards as pathways to broader historical narratives and exhibitions. By focusing on these collaborative and integrative efforts, the "Europeana: Mapping Postcards" project is poised to grow and evolve continuously, reinforcing its stature as a dynamic and interactive portal to Europe's rich cultural and historical heritage.
Enhance user interaction and accessibility
Enhancing user interaction and accessibility within the "Europeana: Mapping Postcards" web application is crucial for its continued development and user engagement. By introducing more interactive features, the application can become more engaging and immersive. Improving navigation within the app will make it more user-friendly and intuitive, allowing users to explore the rich tapestry of Europe's history with ease. Additionally, incorporating accessibility options is essential to cater to a broader audience, including those with disabilities. These enhancements will not only make the application more inclusive but also ensure that a wider range of users can explore and appreciate Europe's cultural and historical heritage through the postcard collection.
Project plan & Milestones
Project plan
| Timeframe | Task | Completion |
|---|---|---|
| Week 4 |
|
✓ |
| Week 5 |
|
✓ |
| Week 6 |
|
✓ |
| Week 7 |
|
✓ |
| Week 8 |
|
✓ |
| Week 9 |
|
✓ |
| Week 10 |
|
✓ |
| Week 11 |
|
✓ |
| Week 12 |
|
✓ |
| Week 13 |
|
✓ |
| Week 14 |
|
✓ |
